Algebra Basics: Graphing On The Coordinate Plane - Math Antics
TLDRIn this Math Antics video, Rob introduces viewers to the concept of graphing, a fundamental skill for understanding mathematical relationships visually. He explains the use of the coordinate plane, which is formed by two perpendicular number lines, called axes, and how to plot points using ordered pairs of coordinates. Rob demonstrates how to locate points on the X and Y axes and then intersect them to find exact locations. He also simplifies the process by using the origin as a starting point and moving in the direction of the coordinates. The video concludes with an explanation of the four quadrants of the coordinate plane and their significance in algebra, emphasizing the practicality of graphing for solving algebraic problems.
Takeaways
- 📈 Graphing is a fundamental tool for understanding mathematical relationships, especially in basic Algebra.
- 🌟 The process of graphing involves turning mathematical relationships into visual representations for better comprehension.
- 🔗 In graphing, points are connected to form a visual representation, which is essential for understanding the data or equation.
- 🎨 Graphing can be seen as a window into the abstract world of math, making it more tangible and easier to grasp.
- 📏 The coordinate plane is a 2-dimensional platform where graphing takes place, providing a stage for plotting coordinates.
- 📊 The number line is the precursor to the coordinate plane, with positive and negative numbers representing movement in one direction.
- 🔄 Rotating the number line 90 degrees creates the number plane, which is a 2-dimensional version, allowing for plotting points in a 2D area.
- 📐 Coordinates are a pair of numbers that specify a point on the number plane, with the first number indicating the X position and the second indicating the Y position.
- 📍 Plotting coordinates involves moving from the origin (0,0) along the X and Y axes, with each number in the ordered pair determining the direction and distance of the movement.
- 🔑 Quadrants are regions of the coordinate plane defined by the X and Y axes, with each quadrant representing a specific combination of X and Y values.
Q & A
What is the main topic of the Math Antics lesson?
-The main topic of the Math Antics lesson is graphing, which is an important foundation for many math problems, especially in basic Algebra.
What does graphing in math mean?
-Graphing in math means taking mathematical relationships and turning them into pictures or visual representations to better understand them.
What is the purpose of the coordinate plane in graphing?
-The coordinate plane serves as a platform or stage where graphing takes place, allowing for the plotting of points in a two-dimensional space.
How does the number line relate to the coordinate plane?
-The coordinate plane is formed by combining two perpendicular number lines, which intersect at their zero points, creating a 2-dimensional space for plotting points.
What are the two axes of the coordinate plane called?
-The two axes of the coordinate plane are called the X-axis (horizontal) and the Y-axis (vertical).
Why are the axes named after variables X and Y?
-The axes are named after variables X and Y because each of the two coordinate numbers is a variable that relates to a specific position along one of the axes, and the names provide flexibility and relevance to the variables used in algebra.
What are the two numbers in a coordinate called and why are they used?
-The two numbers in a coordinate are called 'coordinates' because they work together to specify the location of a point on the coordinate plane. They are used to plot points in a 2-dimensional space.
How are coordinates typically formatted?
-Coordinates are typically formatted as ordered pairs with the two numbers inside parentheses and separated by a comma, such as (X, Y).
How do you plot the coordinates (3, 2) on the coordinate plane?
-To plot the coordinates (3, 2), locate the X value of 3 along the X-axis, draw a line perpendicular to the X-axis, then locate the Y value of 2 along the Y-axis, draw another line perpendicular to the Y-axis, and the point of intersection is the plotted point.
What are the four quadrants of the coordinate plane and how are they defined?
-The four quadrants of the coordinate plane are: Quadrant 1 (upper right, where X and Y are positive), Quadrant 2 (upper left, where X is negative and Y is positive), Quadrant 3 (lower left, where both X and Y are negative), and Quadrant 4 (lower right, where X is positive and Y is negative).
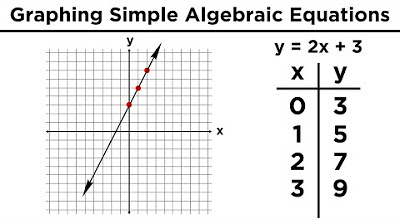
How does graphing relate to basic Algebra?
-Graphing relates to basic Algebra as it helps in understanding equations and functions by visually representing their solutions on the coordinate plane.
Outlines
📚 Introduction to Graphing and the Coordinate Plane
In this paragraph, Rob introduces the concept of graphing as a fundamental skill for understanding mathematical relationships and solving problems in Algebra. He explains that graphing involves turning equations into visual representations, which makes abstract mathematical concepts more tangible. Rob then introduces the 'Coordinate Plane,' which serves as the stage for graphing. He explains the transition from a one-dimensional number line to a two-dimensional number plane, highlighting the importance of coordinates and how they are represented in a format like '(x, y)'. The paragraph sets the stage for understanding how to plot points and graph equations effectively.
📐 Understanding Coordinates and Plotting Points
This paragraph delves into the specifics of how to plot points on the coordinate plane. Rob explains the process of using the first number in an ordered pair to locate a point along the X-axis and the second number to find its position along the Y-axis. He illustrates this with the example of plotting the point (3, 2) by drawing perpendicular lines to both axes until they intersect. Rob then presents an intuitive method for plotting points by starting at the origin and moving in the direction indicated by the coordinates. He demonstrates this with several examples, including points with positive and negative coordinates, and explains the concept of 'Quadrants' in the coordinate plane. Each quadrant is defined by the sign of the X and Y values and is labeled with Roman numerals. The paragraph concludes with the relevance of understanding the coordinate plane for solving algebraic equations.
😉 Closing Remarks and Call to Action
In a sarcastic tone, the final paragraph serves as a closing remark to the video script. It humorously implies that the viewer has just received the information they were looking for, suggesting that the content provided was exactly what they needed. This light-hearted closing encourages viewers to visit www.mathantics.com for more educational content, reinforcing the call to action for further learning.
Mindmap
Keywords
💡Graphing
💡Coordinate Plane
💡Number Line
💡Coordinates
💡Ordered Pairs
💡X-axis and Y-axis
💡Plotting Points
💡Quadrants
💡Algebra
💡Unit Circle
Highlights
Introduction to graphing as a fundamental concept for understanding mathematical relationships and solving problems in Algebra.
Explanation of graphing as a visual representation to make abstract math concepts more tangible.
Introduction of the 'Coordinate Plane' as the foundation for graphing in mathematics.
Description of the Number Line and its transition to a 2-Dimensional 'Number Plane'.
Explanation of how to create a 'number plane' by combining two perpendicular number lines.
Introduction of 'coordinates' as pairs of numbers that specify locations on the number plane.
Format of coordinates using parentheses and commas for clarity.
Differentiation between the 'X-axis' and 'Y-axis' and their role in the coordinate plane.
Use of variable names 'X' and 'Y' for the axes to represent positions along each axis.
Concept of 'ordered pairs' to maintain the consistent order of coordinates.
Method of plotting coordinates by using the first number for the X-axis and the second for the Y-axis.
Technique for plotting points by drawing perpendicular lines to the axes from the given coordinates.
Intuitive method of plotting points starting from the origin and moving in the direction of the coordinates.
Illustration of plotting various coordinates including positive and negative values.
Introduction of 'Quadrants' as regions of the coordinate plane defined by the axes.
Description of each quadrant's characteristics based on the signs of the X and Y values.
Use of Roman Numerals to label the quadrants for easy reference.
Connection between understanding the coordinate plane and solving equations in basic Algebra.
Encouragement to practice plotting points and graphing equations to improve math skills.
Transcripts
Browse More Related Video
Graphing in Algebra: Ordered Pairs and the Coordinate Plane

Three-Dimensional Coordinates and the Right-Hand Rule
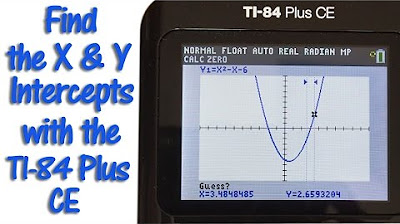
TI 84 Plus CE Calculator Find the X and Y Intercepts
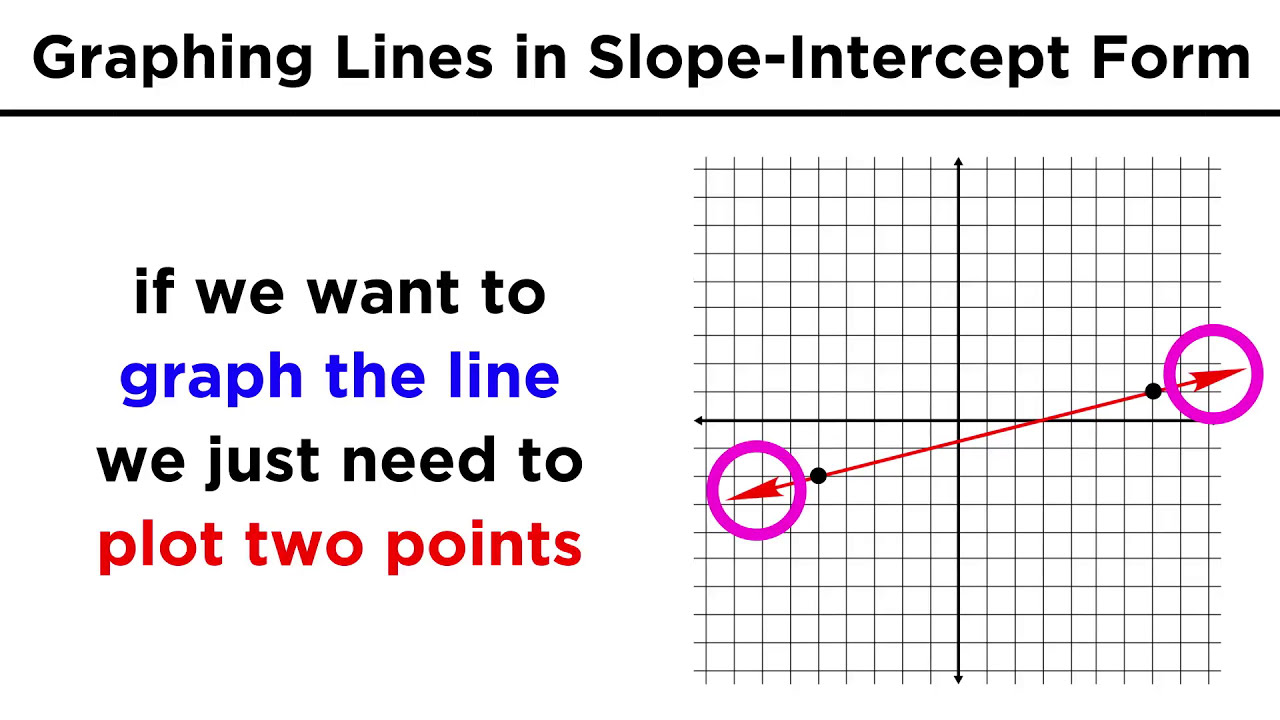
Graphing Lines in Slope-Intercept Form (y = mx + b)
Ch. 1.9 The Coordinate Plane, Graphs of Equations, Circles

Calculus 2: Polar Coordinates (Video #30) | Math with Professor V
5.0 / 5 (0 votes)
Thanks for rating: