Ch. 1.9 The Coordinate Plane, Graphs of Equations, Circles
TLDRThis video script introduces Chapter 1.9 on the coordinate plane, focusing on graphing equations and circles. It emphasizes the importance of graphing in calculus, explaining the Cartesian coordinate system, and how to graph equations as lines and circles. The instructor discusses finding the center and radius of a circle from given points, calculating intercepts, and applying the Pythagorean theorem. The script also covers the concepts of dependent and independent variables, as well as the symmetry of graphs with respect to axes and the origin.
Takeaways
- 📚 The video is an introduction to graphing equations, particularly focusing on the coordinate plane and the Cartesian coordinate system, which is fundamental for understanding calculus.
- 📈 Graphing is essential for visualizing functions, which is crucial in calculus, especially when analyzing functions and their graphs in higher dimensions like calculus 3.
- 📍 The Cartesian coordinate system uses ordered pairs to describe points, with x representing the horizontal distance from the origin and y representing the vertical distance.
- 📉 When graphing, it's important to label and scale the axes evenly to accurately represent the distances and relationships between points.
- 🔍 Set builder notation is used to describe regions of a graph, allowing for the specification of areas that meet certain conditions, such as x values greater than a certain number and y values less than or equal to another number.
- 📐 The Pythagorean theorem is used to calculate the distance between two points in a two-dimensional space, which is key for understanding the geometric relationships in graphs.
- 🔴 The concept of midpoint is introduced, which is the average of the x and y values of two points, and it's significant for finding the center of a line segment connecting two points.
- 🔵 The video emphasizes the importance of understanding intercepts, which are points where a graph crosses the x-axis or y-axis, as they simplify the process of graphing equations.
- ⭕ The equation for a circle in the Cartesian coordinate system is given as (x - h)² + (y - k)² = r², where (h, k) is the center and r is the radius, highlighting a common mathematical form that students may encounter.
- 🔍 The script discusses methods for finding the equation of a circle given certain points, including using the diameter and the intercepts, which is a practical skill in geometry.
- 🔄 The concept of symmetry in graphs is explored, including symmetry about the y-axis, x-axis, and origin, which is important for understanding the properties and transformations of graphs.
Q & A
What is the main topic of Chapter 1.9 in the video transcript?
-The main topic of Chapter 1.9 is the introduction to the coordinate plane, focusing on graphing equations and circles, which is fundamental for understanding calculus.
Why is graphing important in calculus?
-Graphing is important in calculus because it helps in visualizing and analyzing functions and their properties, which is crucial for understanding the behavior of functions in multi-dimensional spaces.
What are the different coordinate systems mentioned in the transcript?
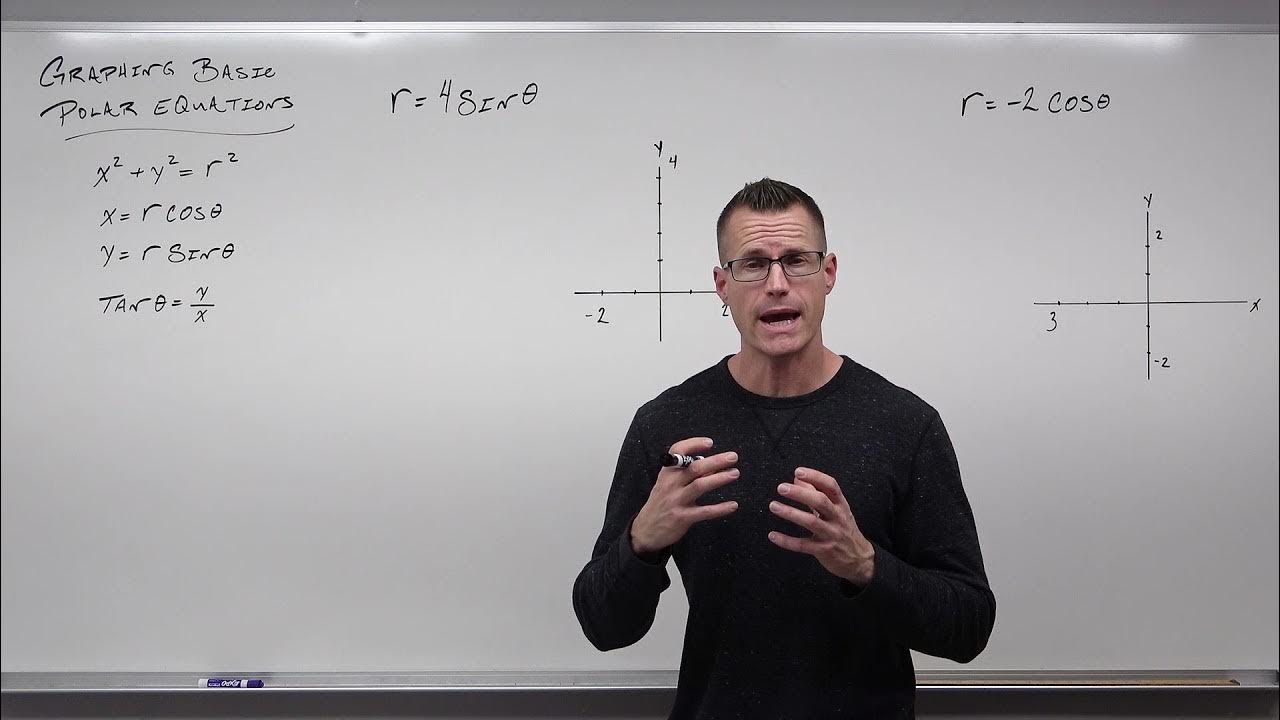
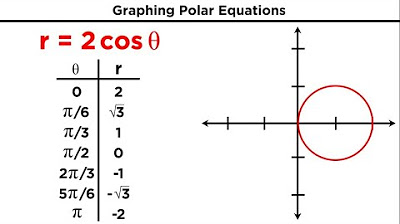
-The transcript mentions the Cartesian (rectangular) coordinate system, and also refers to other systems like polar coordinates and changes of bases, which will be discussed later in the course.
How is a point described in the Cartesian coordinate system?
-A point in the Cartesian coordinate system is described by an ordered pair (x, y), where x represents the horizontal distance from the origin along the x-axis, and y represents the vertical distance from the origin along the y-axis.
What is the significance of the origin in the Cartesian coordinate system?
-The origin in the Cartesian coordinate system is the point (0, 0) and serves as the reference point from which all other points' positions are measured in terms of their distances along the x and y axes.
Why is it important to scale axes evenly when graphing?
-Scaling axes evenly is important because it ensures that the graph accurately represents the values and distances described by the equations, avoiding distortions and misinterpretations.
What is the standard form of the equation of a circle in the Cartesian coordinate system?
-The standard form of the equation of a circle in the Cartesian coordinate system is (x - h)² + (y - k)² = r², where (h, k) is the center of the circle and r is the radius.
What are intercepts in the context of graphing equations?
-Intercepts are the points where a graph crosses the x-axis or y-axis. The x-intercepts occur where the graph crosses the x-axis (y = 0), and the y-intercepts occur where the graph crosses the y-axis (x = 0).
How can you find the center and radius of a circle given its diameter endpoints?
-To find the center and radius of a circle given its diameter endpoints, calculate the midpoint of the two endpoints to find the center (h, k), and then find the distance between the two endpoints, divide it by two to get the radius r.
What is the process of completing the square and why is it used in the context of the given transcript?
-Completing the square is a method used to transform a quadratic equation into a perfect square trinomial, making it easier to identify the equation's properties, such as the center and radius of a circle. In the transcript, it is used to rewrite a given equation into the standard form of a circle's equation.
What does the transcript mean by symmetry of a graph about different axes?
-Symmetry of a graph about different axes refers to the properties of a graph that remains unchanged when reflected across the y-axis (x → -x), x-axis (y → -y), or rotated 180 degrees about the origin (x, y → -x, -y). The transcript discusses how to determine if a given equation has any of these symmetries.
How can you determine if an equation has symmetry about the y-axis?
-To determine if an equation has symmetry about the y-axis, replace every x with -x in the equation and see if the resulting equation is the same as the original. If it is, the graph has y-axis symmetry.
How can you determine if an equation has symmetry about the x-axis?
-To determine if an equation has symmetry about the x-axis, replace every y with -y in the equation and see if the resulting equation is the same as the original. If it is, the graph has x-axis symmetry.
How can you determine if an equation has symmetry about the origin?
-To determine if an equation has symmetry about the origin, replace every x with -x and every y with -y in the equation and see if the resulting equation is the same as the original. If it is, the graph has origin symmetry.
Outlines
📚 Introduction to Graphing in Calculus
This paragraph introduces Chapter 1.9 on graphing equations and circles in the context of calculus. It emphasizes the importance of understanding graphs of functions for success in calculus, especially when analyzing functions and their properties. The instructor mentions various coordinate systems, focusing on the Cartesian coordinate system, and discusses the basics of graphing, including the significance of visualizing functions in higher dimensions as encountered in calculus 3.
📏 Understanding the Cartesian Coordinate System
The paragraph delves into the specifics of the Cartesian coordinate system, explaining how points are represented by ordered pairs of numbers corresponding to their distances from the origin along the x and y axes. It discusses the importance of labeling and scaling axes evenly when graphing and introduces the concept of set builder notation for describing regions on a graph, using inequalities to define areas like points where x is greater than 2 and y is less than or equal to negative three.
📐 The Pythagorean Theorem and Distance Calculation
This section explains how to calculate the distance between two points in a two-dimensional space using the Pythagorean theorem. It introduces the formula for distance, which involves squaring the differences in the x and y coordinates of the two points and then taking the square root of the sum. The explanation includes a step-by-step breakdown of the formula and its application, highlighting the use of absolute values to ensure positive lengths.
🔶 Finding the Midpoint Between Two Points
The paragraph discusses the concept of the midpoint between two points on a graph, which is the central point equidistant from both endpoints. It presents various methods to calculate the midpoint, including averaging the x and y values directly, as well as using the differences between the x and y coordinates. The explanation includes a visual representation to illustrate the process of finding the midpoint.
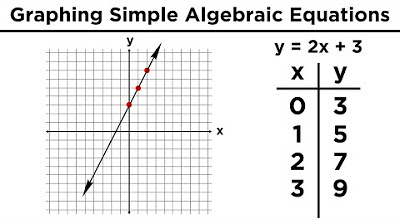
📈 Graphing Equations and Understanding Variables
The focus shifts to graphing equations in two variables, where one variable is typically independent (x) and the other dependent (y). The paragraph outlines a basic method for graphing by selecting numerous x values, calculating corresponding y values, and plotting these points on a graph. It also touches on the idea of intercepts and the importance of understanding the general appearance of various functions for more efficient graphing.
🔍 Identifying Intercepts and Graphing Circles
This section introduces the concept of intercepts, which are points where a graph crosses the x or y axes, and explains the significance of these points in graphing. It also begins an exploration of circles, discussing their representation in the Cartesian coordinate system with a center (h, k) and radius r. The paragraph sets up the standard equation for a circle and mentions the importance of understanding circles, which are often overlooked in algebra courses.
🔄 Finding the Equation of a Circle Given Diameter Points
The paragraph provides an example of finding the equation of a circle when given two points that lie on its diameter. It explains the process of calculating the radius from the distance between the two points and finding the midpoint to determine the center of the circle. The summary includes the steps for deriving the equation of the circle using the standard form and the values obtained from the given points.
🔢 Solving for Intercepts and Completing the Square
This section continues the discussion on circles, focusing on finding x and y-intercepts by setting x or y to zero in the circle's equation and solving the resulting quadratic equations. The paragraph demonstrates the process of completing the square to solve for the intercepts and provides the solutions for both x and y-intercepts of the example circle.
🔄 Transforming Equations to Identify Circles
The paragraph discusses the process of transforming a given equation into the standard form of a circle's equation. It involves grouping x and y terms, completing the square for both, and adjusting the equation to reveal the center and radius of the circle. The explanation shows how to manipulate the given equation to identify the hidden circle and its properties.
🔄 Symmetry in Graphs and Function Analysis
This section introduces the concept of symmetry in graphs, explaining how to determine if a graph is symmetric about the y-axis, x-axis, or origin by analyzing the equation of the function. The paragraph provides an example of testing symmetry for the function y = x^3 + 1, demonstrating the process of substituting negative values for x and y to check for identical outcomes in the equation.
📉 Conclusion on Symmetry and Graph Analysis
The final paragraph concludes the discussion on symmetry, summarizing the findings that the graph of y = x^3 + 1 lacks symmetry across any axis. It reinforces the idea that not all graphs exhibit symmetry and provides a brief overview of the concepts covered in the video, inviting viewers to join for the next installment in the series.
Mindmap
Keywords
💡Coordinate Plane
💡Graphing
💡Polar Coordinates
💡Functions
💡Circle
💡Radius
💡X-intercepts and Y-intercepts
💡Pythagorean Theorem
💡Midpoint
💡Symmetry
Highlights
Introduction to the coordinate plane and graphing equations, emphasizing the importance of graphing in calculus.
Explanation of the Cartesian coordinate system as the standard for graphing.
Description of a point in the coordinate system using an ordered pair (x, y).
Importance of labeling and scaling axes evenly when drawing graphs.
Use of set builder notation to describe regions of a graph.
Introduction to the concept of distance between two points using the Pythagorean theorem.
Explanation of how to calculate the midpoint between two points.
Differentiation between independent and dependent variables in functions.
Method of graphing equations by choosing numerous values for x and finding corresponding y values.
Discussion on the concept of intercepts and their significance in graphing.
Introduction to the equation and properties of a circle in the coordinate plane.
Example problem: Finding the equation of a circle given two points on its diameter.
Process of finding the x and y-intercepts of a circle from its equation.
Technique to rewrite a given equation into the standard form of a circle's equation by completing the square.
Concept of symmetry in graphs, including symmetry about the y-axis, x-axis, and origin.
Example analysis to determine the symmetry of the graph of the equation y = x^3 + 1.
Conclusion summarizing the importance of understanding graphing and symmetry in calculus.
Transcripts
Browse More Related Video
5.0 / 5 (0 votes)
Thanks for rating: