Graphing in Algebra: Ordered Pairs and the Coordinate Plane
TLDRIn this educational video, Professor Dave introduces the concept of graphing lines on the coordinate plane, a fundamental aspect of algebra. He starts with the simple equation Y equals X, explaining how each pair of X and Y values forms ordered pairs that can be plotted on a graph. Through examples, he demonstrates how graphs visually represent the relationship between two variables, making it easier to comprehend and solve algebraic equations. He also covers how to interpret graphs for different equations, like Y equals 2X plus 3, and emphasizes the importance of understanding the coordinate plane for future mathematical studies.
Takeaways
- 📚 Algebra is not only about manipulating equations but also involves a significant amount of graphing to visually represent the relationship between variables.
- 📈 The equation Y = X demonstrates a simple relationship where Y is equal to X, leading to a direct correlation between these two variables on a graph.
- 🔬 A coordinate plane, consisting of a horizontal X-axis and a vertical Y-axis, is used to plot the relationship between two variables, dividing the plane into four quadrants.
- 📖 Ordered pairs (X, Y) are used to represent points on the coordinate plane, with X indicating the position along the horizontal axis and Y along the vertical axis.
- 📅 Creating a table of X values and their corresponding Y values can help visualize the relationship before plotting them on the graph.
- 🗺️ Each point on the graph corresponds to an ordered pair, and connecting these points reveals the continuous nature of the equation, accommodating all real numbers.
- 📉 The line on a graph represents the equation itself, showing all possible values that satisfy the equation.
- 📊 Graphing allows for visual inferences about relationships and solutions to equations without complex calculations, especially as equations become more intricate.
- 📝 Graphing transforms abstract equations into tangible geometric objects, enriching our understanding and perspective of mathematical relationships.
- 🚡 Multiple perspectives in math, such as algebraic manipulation and geometric graphing, enhance problem-solving abilities and comprehension.
Q & A
What is a coordinate plane and what are its key components?
-A coordinate plane is a grid consisting of two number lines - the X and Y axes. These lines intersect at a central point called the origin and divide the plane into four quadrants.
How do you describe the location of a point on the coordinate plane?
-The location of a point is described using an ordered pair notation with the X coordinate listed first, followed by the Y coordinate. For example, the ordered pair (2, 3) locates the point 2 units across on the X axis and 3 units up on the Y axis.
What does it mean when an equation is graphed as a line?
-When an equation is graphed as a line, it means that the line contains all possible real number solutions (x,y) that satisfy the relationship described by the equation.
How can a graph help you make inferences about an algebraic system?
-By examining the graphical representation of an equation, you can discover certain qualities like intercepts and slopes without needing to perform algebraic calculations. This allows you to better understand and describe the system.
What were some key points plotted on the initial graph? Why were they selected?
-Some key points plotted were (0,0) which is the origin, (1,1), (2,2), (3,3) etc. These integer coordinate pairs satisfy the initial equation Y=X so they demonstrate the relationship between X and Y clearly.
What is the significance of the point where a graphed line crosses the X-axis?
-The point where the line crosses the X-axis indicates where Y equals 0. So the X value at that coordinate gives the value of X that makes Y=0 in the equation.
How does graphing provide a different perspective on math concepts?
-Graphing allows us to visualize algebraic relationships and equations geometrically. This links together different areas of math and allows for new intuitions and problem-solving approaches.
What are some ways to determine key points to plot for a line?
-You can pick convenient integer values for X and solve for Y, ensure you have points in all four quadrants, find intercepts, or identify any important features of the line algebraically first.
What are some disadvantages of purely algebraic solutions?
-Algebraic solutions can become very complex and tedious to solve analytically as equations get more complicated. A graph provides an intuitive visual that may reveal relationships that are hard to see algebraically.
How could you find the X-intercept algebraically and confirm it geometrically?
-Set Y=0 and solve for X. Then note where the graphed line intersects the X-axis and check that the coordinate at that point matches your algebraic solution.
Outlines
📈 Graphing Lines in Math
This first paragraph introduces the idea of graphing lines as visual representations of algebraic equations. It explains how a simple linear equation like Y=X can be plotted on a coordinate plane, with each point satisfying the relationship between X and Y. Ordered pairs are used to label points corresponding to different (X,Y) solutions. Connecting these points results in a line representing all possible real number solutions to the equation.
😎 Using Graphs to Understand Equations
The second paragraph builds on the first by showing how graphs can provide information about an equation that would otherwise require algebra to solve. The example of Y=2X+3 is used to demonstrate how visual analysis of the graph reveals solutions that would be more difficult through calculation. Overall, graphing is presented as a valuable skill in math for gaining geometric perspectives and inferences into algebraic systems.
Mindmap
Keywords
💡Algebra
💡Graphing
💡Coordinate Plane
💡Axes
💡Quadrants
💡Ordered Pairs
💡Origin
💡Line
💡Independent and Dependent Variables
💡Intercepts
Highlights
Introduction to graphing lines in algebra.
Algebra involves both equation manipulation and graphing.
Graphs serve as visual representations of equations.
Example of a simple equation: Y equals X.
Charting X and Y values demonstrates their relationship.
Introduction of the coordinate plane and its quadrants.
Placing ordered pairs on the coordinate plane.
The concept of the origin and its significance.
Connecting dots to represent the equation Y equals X.
Introducing a new equation: Y equals 2X plus 3.
Creating a table to explore the relationship between X and Y.
Graphing to understand the equation's implications visually.
Using graphs to make inferences without mathematical calculations.
Graphs provide a new perspective on mathematical equations.
The importance of understanding the coordinate plane for future math studies.
Transcripts
Browse More Related Video
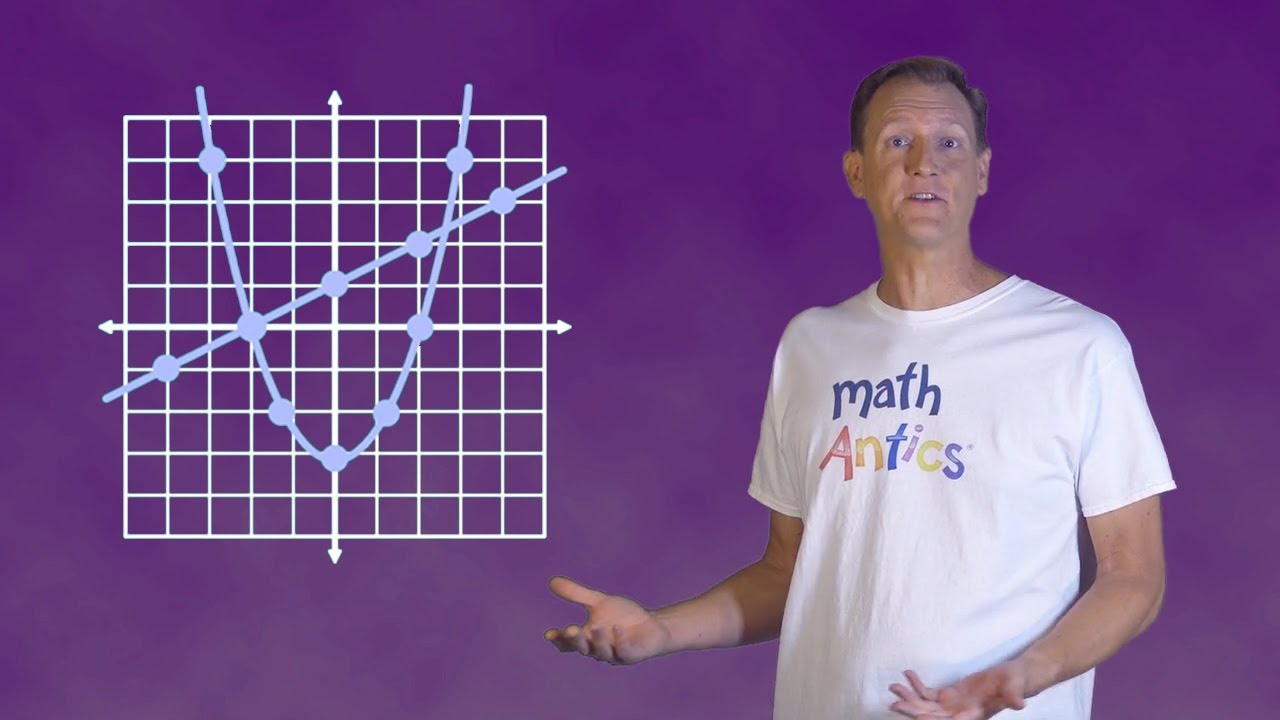
Algebra Basics: Graphing On The Coordinate Plane - Math Antics
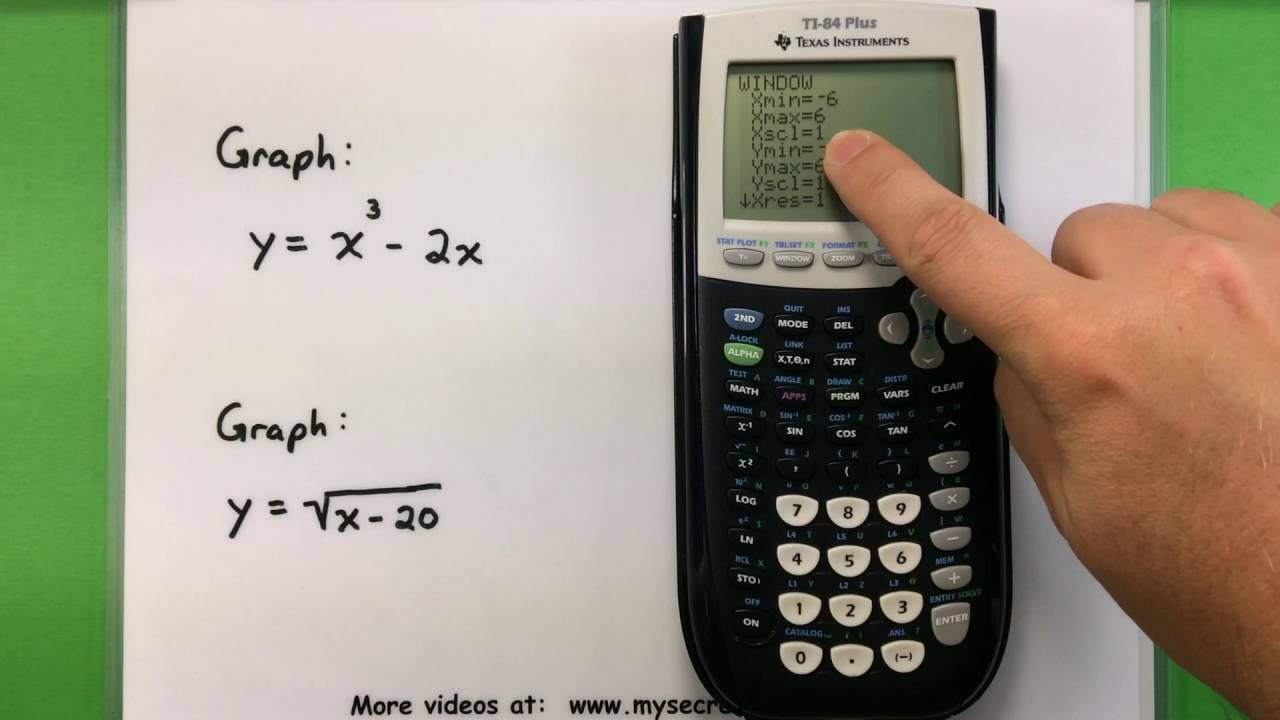
Basic Math - Graphing with a Ti-83 or Ti-84 Calculator
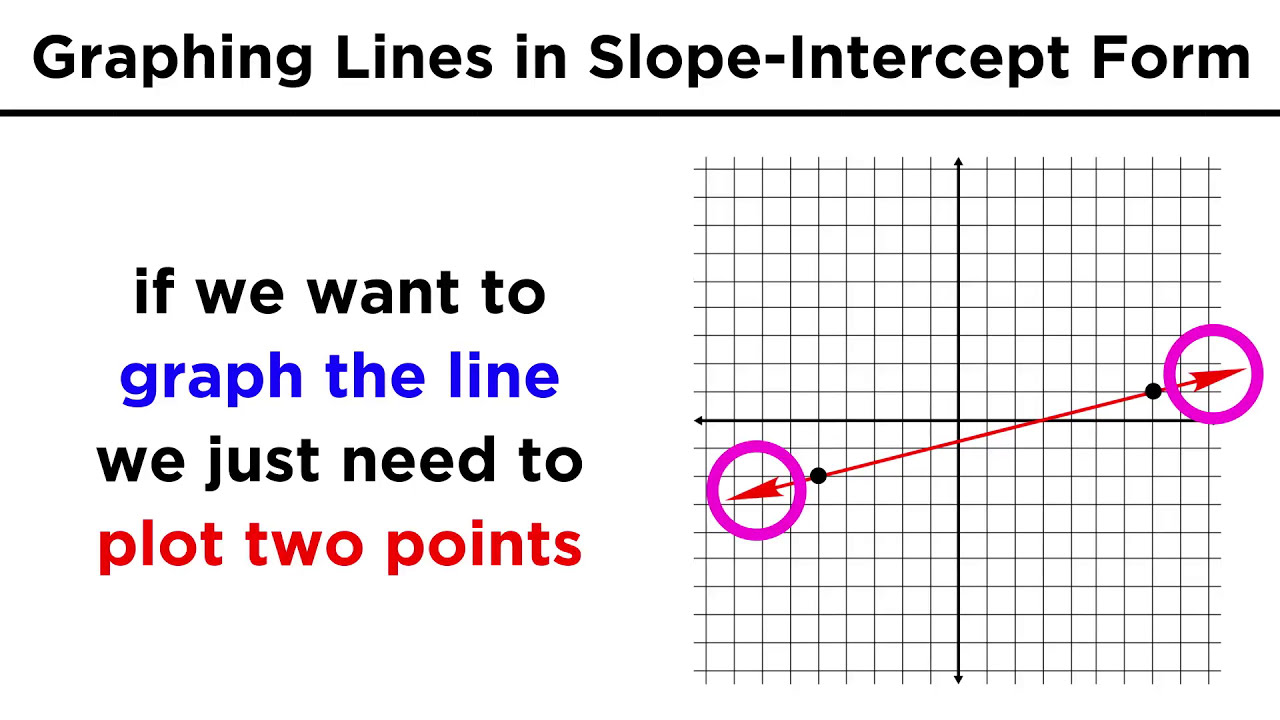
4 Steps to Graphing Slope-Intercept Form | 8.EE.B.6 💗
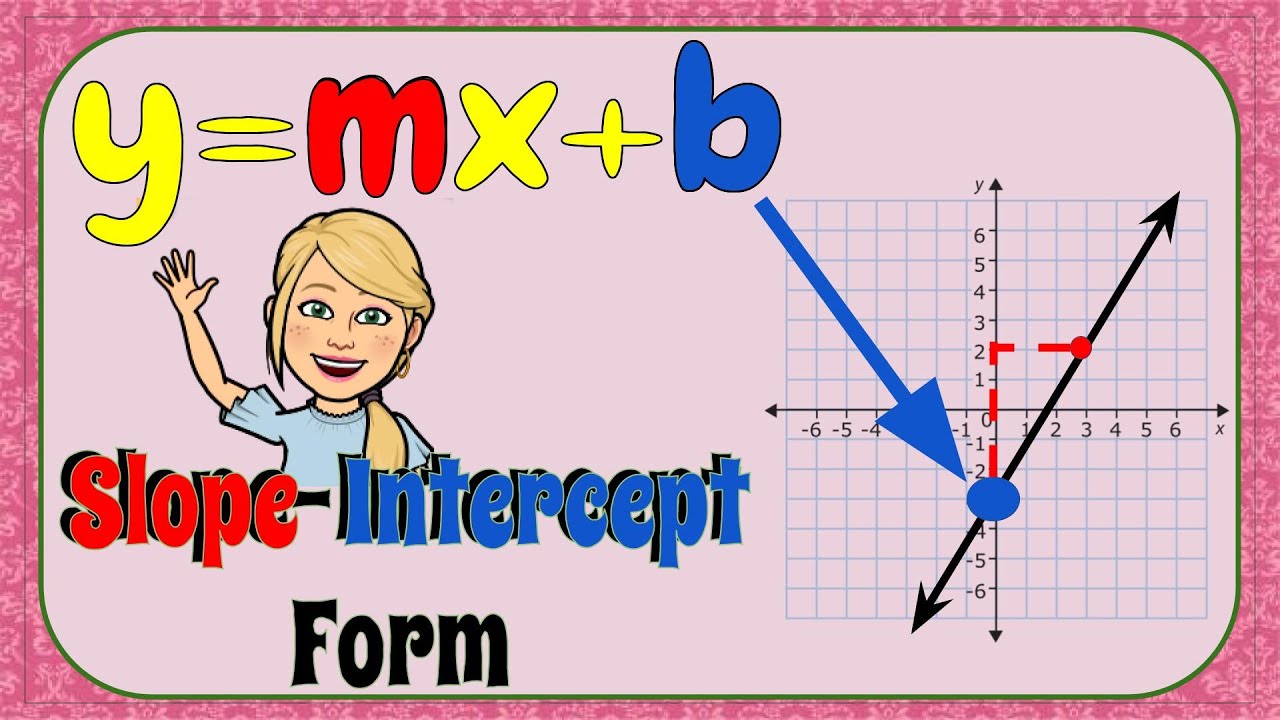
Graphing Lines in Slope-Intercept Form (y = mx + b)
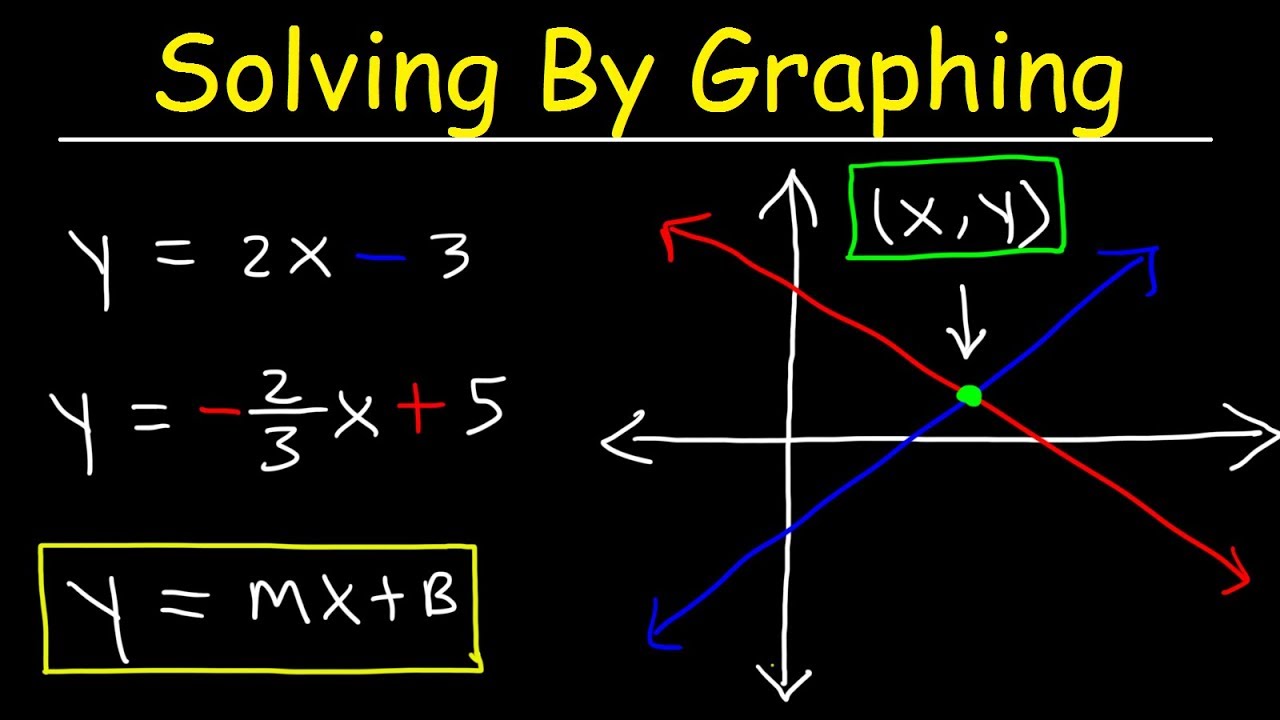
Solving Systems of Equations By Graphing
Ch. 1.9 The Coordinate Plane, Graphs of Equations, Circles
5.0 / 5 (0 votes)
Thanks for rating: