Types Of Distribution In Statistics | Probability Distribution Explained | Statistics | Simplilearn
TLDRThis educational video delves into the realm of probability distributions, focusing on the normal, binomial, and Poisson distributions. It explains the concept of a probability distribution and its significance in various fields. The video illustrates the characteristics of the normal distribution, including its symmetrical bell curve, and introduces key terms such as continuous probability density and standard deviation. It also covers the binomial distribution for trials with two outcomes and the Poisson distribution for events occurring at a constant rate over time. Practical examples and a problem for viewers to solve are included to enhance understanding.
Takeaways
- 📊 Probability Distribution is a statistical tool that lists all possible outcomes of a random variable along with their probabilities.
- 📈 Normal Distribution is a continuous probability density function that results in a symmetrical bell curve, representing data clustered around a central value without bias to the left or right.
- 📚 Continuous Probability Density is a distribution where the random variable can take any value, making it impossible to assign a probability to a single exact value.
- 📉 Standard Deviation is a measure of data spread, indicating how values differ from the mean and is calculated as the square root of variance.
- 📝 The Standard Normal Distribution has a mean of zero and a standard deviation of one, simplifying the comparison of different data sets and probability calculations.
- 🔢 Z-Score is a measure indicating how many standard deviations an element is from the mean, useful for standardizing data and comparing it across different distributions.
- 🎲 Random Experiment is a well-defined procedure that produces an observable outcome that cannot be perfectly predicted in advance.
- 🎯 Random Variable is a numerical description of an outcome in a statistical experiment, which can be discrete (finite values) or continuous (any value in an interval).
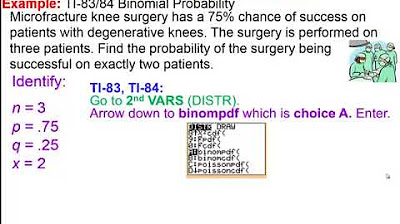
- 🃏 Binomial Distribution is used for experiments with exactly two outcomes (success/failure) and is calculated using the binomial coefficient formula.
- 📦 Poisson Distribution is used to model the number of events happening independently in a fixed interval of time or space, with a given average rate of occurrence.
- 🚂 Application of Poisson Distribution includes calculating the likelihood of rare events such as deaths due to a rare disease, number of mishandled baggage, or computer virus infections.
Q & A
What is a probability distribution?
-A probability distribution is a list of all possible outcomes of a random variable along with their corresponding probability values. It is used in various fields to understand the likelihood of different outcomes.
Why is the normal distribution called 'normal'?
-The normal distribution is called 'normal' because it represents a common way in which data is distributed, with the average being the highest point and all other data points having a lower likelihood, forming a symmetrical bell curve.
What is a continuous probability density?
-Continuous probability density is a probability distribution where the random variable can take any given value within an infinite range of values, making it impossible to determine the probability of a single exact value.
What is a probability density function and why is it used?
-A probability density function is a statistical measure that defines the range of values a continuous random variable can take. It is used to capture the likelihood of a value occurring within a continuous range.
How is standard deviation calculated and what does it represent?
-Standard deviation is calculated as the square root of the variance, which is the squared average of the differences between each data point and the mean. It represents the dispersion of a data set relative to its mean, indicating how spread out the data is.
What is the standard normal distribution and its significance?
-The standard normal distribution is a type of normal distribution with a mean of zero and a standard deviation of one. Its significance lies in the ease of comparing different data sets and calculating probabilities, as it provides a standardized reference point.
What are the properties of the standard normal distribution that facilitate easy calculations?
-The properties include: 68% of values fall within the first standard deviation, 95% within the second, and 99.7% within the third. These properties allow for easy comparison and calculation across different data sets.
What is a z-score and how is it used?
-A z-score indicates how many standard deviations an individual data point is from the mean. It is used to standardize scores across different distributions and to find the relative position of a data point within a distribution.
What are the conditions for a binomial distribution?
-The conditions for a binomial distribution include a fixed number of trials, only two mutually exclusive outcomes (success or failure), a constant probability of success for each trial, and independence of trials where the outcome of one does not affect another.
How is the binomial coefficient calculated and what does it represent?
-The binomial coefficient is calculated using the formula nCr * p^r * (1-p)^(n-r), where r is the number of successes, n is the number of trials, p is the probability of success, and (1-p) is the probability of failure. It represents the probability of observing exactly r successes in n trials.
What is the Poisson distribution and when is it used?
-The Poisson distribution is a probability distribution used to model the number of times an event is likely to occur over a given period of time, given the average rate of occurrence. It is used in cases where the chances of any individual event being a success are very small.
How is the probability calculated in a Poisson distribution?
-The probability in a Poisson distribution is calculated using the formula e^(-λ) * λ^x / x!, where x is the number of times the event occurs, λ is the average rate of occurrence, and e is the base of the natural logarithm (approximately 2.7182).
Outlines
📊 Introduction to Probability Distributions
This paragraph introduces the concept of probability distribution, explaining it as a list of all possible outcomes of a random variable along with their corresponding probability values. It highlights the importance of this concept in various fields and introduces the three main types of distributions: normal, binomial, and Poisson. The normal distribution is described as a continuous probability density function that results in a symmetrical bell curve, often observed in data that clusters around a central value without bias to the left or right. An example of height distribution in a class is given to illustrate this concept, showing how the average height is the most common and likelihood decreases as one moves away from the average in either direction.
📈 Understanding Standard Deviation and Normal Distribution
This section delves into the concept of standard deviation, which measures the dispersion of a dataset relative to its mean. It explains how a higher standard deviation indicates a more spread out dataset, using the example of income disparities between rural and urban areas. The paragraph also describes how to calculate standard deviation through the process of finding the squared average of the differences between each data point and the mean. Furthermore, it introduces the standard normal distribution, a specific type of normal distribution with a mean of zero and a standard deviation of one, and explains its properties, including the proportion of values falling within certain standard deviation intervals.
📉 Properties of Standard Normal Distribution and Z-Score
The paragraph discusses the properties of the standard normal distribution that facilitate easy calculations, such as the percentage of values falling within specific standard deviation intervals. It then introduces the concept of the Z-score, which measures how many standard deviations an individual data point is from the mean. The Z-score is calculated by subtracting the mean from the data point and dividing by the standard deviation. The paragraph provides an example using daily travel time data to demonstrate how to calculate the mean, standard deviation, and Z-score, explaining the significance of these values in understanding data distribution.
🎲 Basics of Probability: Outcomes, Experiments, and Variables
This section covers fundamental probability terms such as outcomes, random experiments, events, and sample space. It defines an outcome as the result of a random experiment, like flipping a coin or rolling a die, and a random experiment as a well-defined procedure with an unpredictable outcome. The concept of sample space is introduced as the set of all possible outcomes of a random experiment. Additionally, the paragraph explains the difference between discrete and continuous random variables, providing an example of a discrete random variable representing the sum of numbers when two dice are rolled.
🚀 Binomial and Poisson Distributions in Statistics
The final paragraph introduces two specific types of probability distributions: binomial and Poisson. The binomial distribution is used for experiments with exactly two outcomes, success and failure, and is calculated using a specific formula involving the binomial coefficient. The paragraph outlines the conditions for a binomial experiment and provides an example involving the tossing of a die. In contrast, the Poisson distribution is used for counting the number of events likely to happen over a given period of time at a constant rate. It is used in scenarios where the probability of an individual event is very small. The paragraph concludes with an example of how to calculate the Poisson distribution and poses a problem for the audience to solve involving the arrival of trains at a station.
Mindmap
Keywords
💡Probability Distribution
💡Normal Distribution
💡Continuous Probability Density
💡Probability Density Function (PDF)
💡Standard Deviation
💡Standard Normal Distribution
💡Z-Score
💡Binomial Distribution
💡Poisson Distribution
💡Random Variable
Highlights
Introduction to probability distribution as a list of all possible outcomes of a random variable with corresponding probability values.
Discussion of the three main types of probability distributions: normal, binomial, and Poisson.
Explanation of normal distribution as a continuous probability density function resulting in a symmetrical bell curve.
Illustration of normal distribution using a graph showing height distribution in a class.
Description of continuous probability density where a random variable can take any value within an infinite range.
Clarification of probability density function as a statistical measure defining the range of values for a continuous random variable.
Introduction to standard deviation as a measure of dispersion of a data set relative to its mean.
Example of calculating standard deviation using the height of various dogs.
Introduction to standard normal distribution with a mean of zero and a standard deviation of one.
Properties of standard normal distribution, including the percentage of values within certain standard deviation intervals.
Definition and calculation of z-score to determine how far a data point is from the mean in terms of standard deviations.
Example of calculating the mean, standard deviation, and z-scores using daily travel time data.
Basics and terminology of probability, including outcome, random experiment, random events, and sample space.
Explanation of random variable as a numerical description of the outcome of a statistical experiment.
Introduction to binomial distribution for experiments with exactly two mutually exclusive outcomes, labeled success and failure.
Conditions required for a binomial experiment and an example of calculating probabilities using binomial coefficients.
Introduction to Poisson distribution as a probability distribution to show the number of times an event is likely to occur over a given period of time.
Formula for Poisson distribution and its application in calculating the likelihood of events occurring a specific number of times.
Examples of real-world applications of Poisson distribution, such as calculating the number of deaths due to a rare disease.
A problem for the audience to solve involving calculating the probability of a specific number of train arrivals using Poisson distribution.
Conclusion of the tutorial with an invitation for viewers to like, subscribe, and participate in the comment section.
Transcripts
Browse More Related Video


5.0 / 5 (0 votes)
Thanks for rating: