Fatigue Failure | Engineering Approach
TLDRThis video lecture delves into the practical engineering aspects of fatigue and failure, focusing on determining a material's endurance strength through the rotating beam test. It highlights the unrealistic nature of endurance limits obtained from ideal conditions and introduces factors that influence a material's realistic endurance limit, such as surface finish (factor ka), size (factor k), design reliability (factor kc), and material discontinuities (factor kd). The lecture also discusses the modified Goodman diagram, which provides a more accurate representation of stress-strain behavior in materials under fatigue conditions, especially when stress amplitude approaches zero.
Takeaways
- 🔬 The endurance strength of a material is typically determined through a rotating beam test known as the S-N test.
- 🛠 The ideal endurance limit obtained from S-N tests can be unrealistic for practical applications due to the use of highly polished, homogeneous specimens without surface defects.
- 🔍 Surface defects such as scratches can significantly reduce the endurance limit by initiating micro crack growth, and this effect is represented by the surface finish factor (ka).
- 📏 The size factor accounts for the increased likelihood of surface defects with larger surface areas, and it can be determined as a function of diameter.
- 🔄 The reliability of fatigue design can be improved by adjusting the endurance limit through a factor (kc), which is set for a specified reliability level.
- ⚙️ Discontinuities in the material can cause stress concentration and reduce the endurance limit, an effect captured by the discontinuity factor (kd).
- 📉 The endurance limit is not a material property like tensile or shear strength, as it is influenced by various factors including surface finish and discontinuities.
- 📈 To obtain a realistic endurance limit, all relevant parameters and their effects must be incorporated, each represented by factors with values less than one.
- 📊 The Goodman diagram is used to predict material failure under variable stress but tends to deviate when stress amplitude is near zero, suggesting a need for modification.
- 🛑 A modified Goodman diagram is proposed, which connects yield stress values and follows the yield line until the intersection, after which the Goodman line is followed, offering a more accurate prediction.
Q & A
What is the purpose of the rotating beam test in determining the endurance strength of a material?
-The rotating beam test is used to determine the endurance strength of a material by subjecting a highly polished homogeneous test specimen to fluctuating bending stress due to rotation and gradually reducing the load until the specimen never breaks, identifying the endurance limit of the material.
Why are the endurance limits obtained from the rotating beam test considered unrealistic for practical uses?
-The endurance limits obtained from the rotating beam test are considered unrealistic because they are derived using highly polished homogeneous specimens with zero surface defects. In real-world applications, metal surfaces can have scratches and other surface defects that can cause the specimen to fail before reaching the ideal endurance limit.
What is a surface finish factor (ka) and how does it affect the endurance limit of a material?
-The surface finish factor (ka) represents the effect of scratches and poor surface finish on the endurance limit of a material. Poor surface finish can initiate the growth of micro-cracks, significantly reducing the endurance limit value. The value of ka depends on the manufacturing method and tensile strength of the material.
What is the size factor and how does it relate to the surface area of a workpiece?
-The size factor, also known as the surface area factor, accounts for the increased likelihood of surface defects as the size and surface area of a workpiece increase. Larger workpieces have more surface area, which in turn can have more surface defects, affecting the endurance limit of the material.
What does the reliability factor (kc) signify in the context of fatigue design?
-The reliability factor (kc) is used to improve the reliability of fatigue design. It accounts for the fact that a fatigue test typically has only a 50% reliability. By adjusting kc, designers can specify a higher reliability that the material will not fail under certain conditions.
How do discontinuities in the material affect the endurance limit and what is the associated factor?
-Discontinuities in the material can cause stress concentration or increase stress, which in turn reduces the endurance limit value. A factor kd is used to capture this effect, ensuring that the endurance limit is adjusted to account for the presence of discontinuities.
What is the significance of the Goodman diagram in the context of fatigue analysis?
-The Goodman diagram is used to predict the fatigue life of a material under variable stress amplitudes. It helps in understanding how materials behave under combined stresses where the mean stress is not zero, and it is particularly useful for materials that exhibit linear or non-linear behavior under variable loading.
Why is it logical to modify the Goodman diagram as described in the script?
-It is logical to modify the Goodman diagram to account for situations where the stress amplitude is near zero. The original diagram tends to deviate and almost reaches the yield stress value, which is not accurate. By connecting yield stress values in the abscissa and ordinate up to the intersection and following the yield line, a more accurate prediction of fatigue life can be made, known as the modified Goodman diagram.
What is the safe stress amplitude according to the modified Goodman diagram?
-The safe stress amplitude, according to the modified Goodman diagram, is the stress level that should not be exceeded if the stress is completely reversible or when the mean stress value is zero. This helps in ensuring the material does not fail under fatigue.
How do the various factors discussed in the script contribute to obtaining a realistic endurance limit value?
-The various factors, including surface finish (ka), size (surface area), reliability (kc), and discontinuity (kd), contribute to a more realistic endurance limit value by accounting for real-world conditions that can affect the fatigue life of a material. By incorporating these factors, engineers can better predict and design for the fatigue performance of materials under practical use.
Outlines
🔍 Understanding Fatigue and Endurance Strength
This paragraph introduces the concept of fatigue failure in engineering and discusses the process of determining a material's endurance strength through the rotating beam test. It explains that a highly polished and homogeneous test specimen is subjected to fluctuating bending stress until it fails due to fatigue. The paragraph emphasizes that the endurance limit obtained from this test is often unrealistic for practical applications because it does not account for real-world conditions such as surface defects and discontinuities. These factors can significantly reduce the material's actual endurance limit, highlighting the need to consider additional parameters to obtain a more realistic value.
🔧 Factors Influencing Endurance Limit
This section delves into the various factors that affect the endurance limit of a material, which are not considered in the basic rotating beam test. It discusses the impact of surface finish, represented by the factor 'ka', which accounts for the initiation of micro-cracks due to poor surface finish, significantly reducing the endurance limit. The 'size factor' is introduced, which considers the increased likelihood of surface defects as the workpiece size and surface area increase. The paragraph also addresses the 'reliability factor' 'kc', which is used to improve the reliability of the design for fatigue, with a 50% reliability for the standard fatigue test. Lastly, the 'discontinuity factor' 'kd' is explained, which captures the effect of stress concentration caused by material discontinuities, further reducing the endurance limit. The paragraph concludes by illustrating how incorporating all these factors results in a more accurate and safe stress amplitude for the material.
📈 Modified Goodman Diagram for Fatigue Design
The final paragraph discusses the practical application of the endurance limit in design, specifically addressing the limitations of the Goodman diagram when the stress amplitude is near zero. It points out that the Goodman diagram tends to deviate and approach the yield stress value in such cases. To address this, the paragraph introduces a modified Goodman diagram, which connects the yield stress values in the abscissa and ordinate up to the intersection with the yield line, and then follows the Goodman line. This modification provides a more logical and accurate representation for fatigue design, especially when dealing with reversible stress or when the stress mean value is zero.
Mindmap
Keywords
💡Fatigue
💡Failure
💡Endurance Strength
💡Rotating Beam Test
💡Highly Polished Homogeneous Specimen
💡Surface Defects
💡Surface Finish Factor (ka)
💡Size Factor
💡Reliability Factor (kc)
💡Discontinuities
💡Modified Goodman Diagram
Highlights
Introduction to fatigue analysis in a practical engineering context.
Endurance strength testing through rotating beam test.
Use of highly polished homogeneous test specimens.
Inducing fluctuating bending stress to cause fatigue failure.
Gradual reduction of load to determine endurance limit.
Realism issues with endurance limits due to ideal test conditions.
Influence of surface defects and discontinuities on endurance limit.
Endurance limit not a material property like tensile or shear strength.
Incorporating parameters to obtain a realistic endurance limit value.
Effect of scratches on surface finish and its impact on endurance limit.
Introduction of surface finish factor 'ka'.
Reliability improvement through fatigue test factor 'kc'.
Effect of material discontinuities and stress concentration.
Use of factor 'kd' to account for material discontinuities.
Comprehensive formula for a realistic endurance value.
Discussion on Goodman diagram and its deviations.
Introduction of modified Goodman diagram for improved accuracy.
Conclusion and thanks for watching the video.
Transcripts
Browse More Related Video
23. Solving the Neutron Diffusion Equation, and Criticality Relations
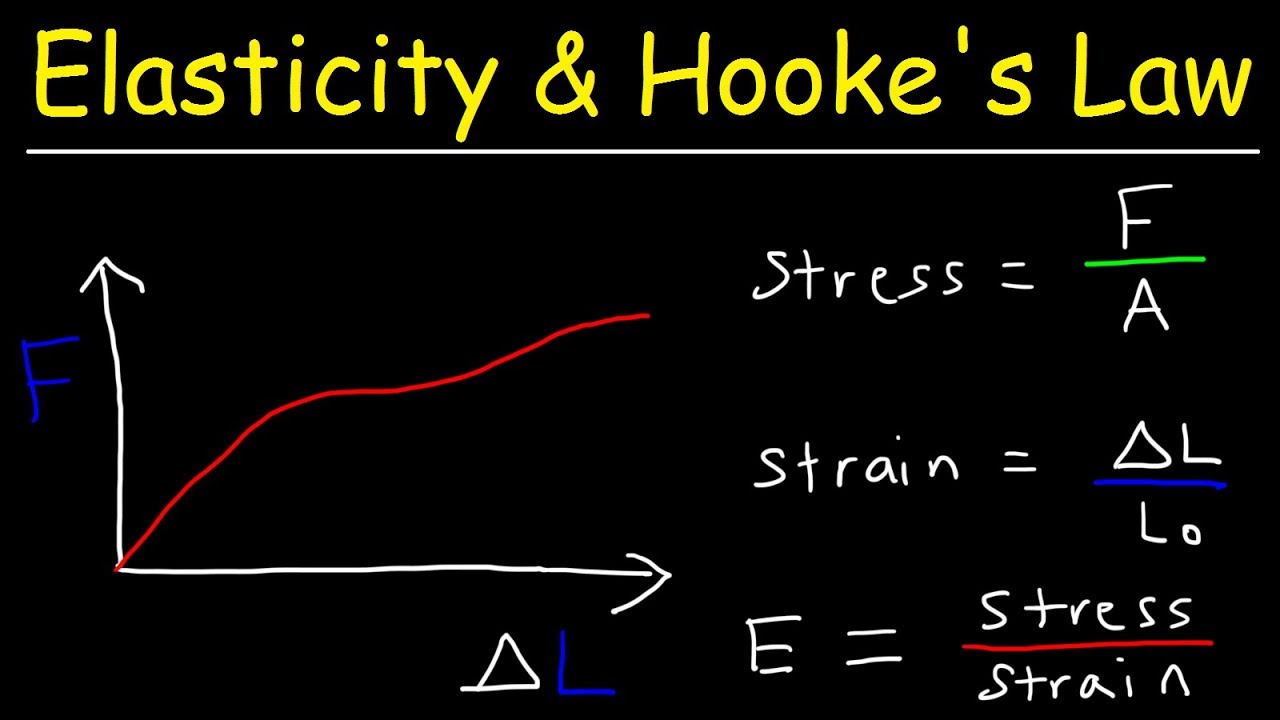
Elasticity & Hooke's Law - Intro to Young's Modulus, Stress & Strain, Elastic & Proportional Limit

One Factor vs. Two Factor ANOVA [One Way vs Two Way]
25. Review of All Nuclear Interactions and Problem Set 7 Help
Synthetic Division and Long Division of Polynomials (Precalculus - College Algebra 32)

AP Chemistry Unit 7 Review: Equilibrium!
5.0 / 5 (0 votes)
Thanks for rating: