Linear Regression Using Least Squares Method - Line of Best Fit Equation
TLDRThe video illustrates using the least squares method to find the best-fit linear equation for given data points. It steps through creating a table to calculate the sums of x, y, xy, and x^2 values. Using these sums in the linear regression formulae, it calculates the slope and y-intercept. After checking some x and predicted y value pairs confirm the equation's accuracy, the video shows using Excel's SLOPE and INTERCEPT functions to expedite finding these parameters. This saves time when analyzing science data to write an equation modeling it.
Takeaways
- 😀 The video will focus on linear regression using the least squares method to find the best fitting line for a dataset
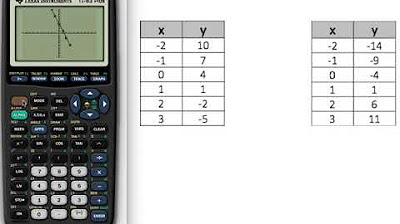
- 👨🏫 Steps include creating a table with x, y, xy and x^2 values and finding the sums of each column
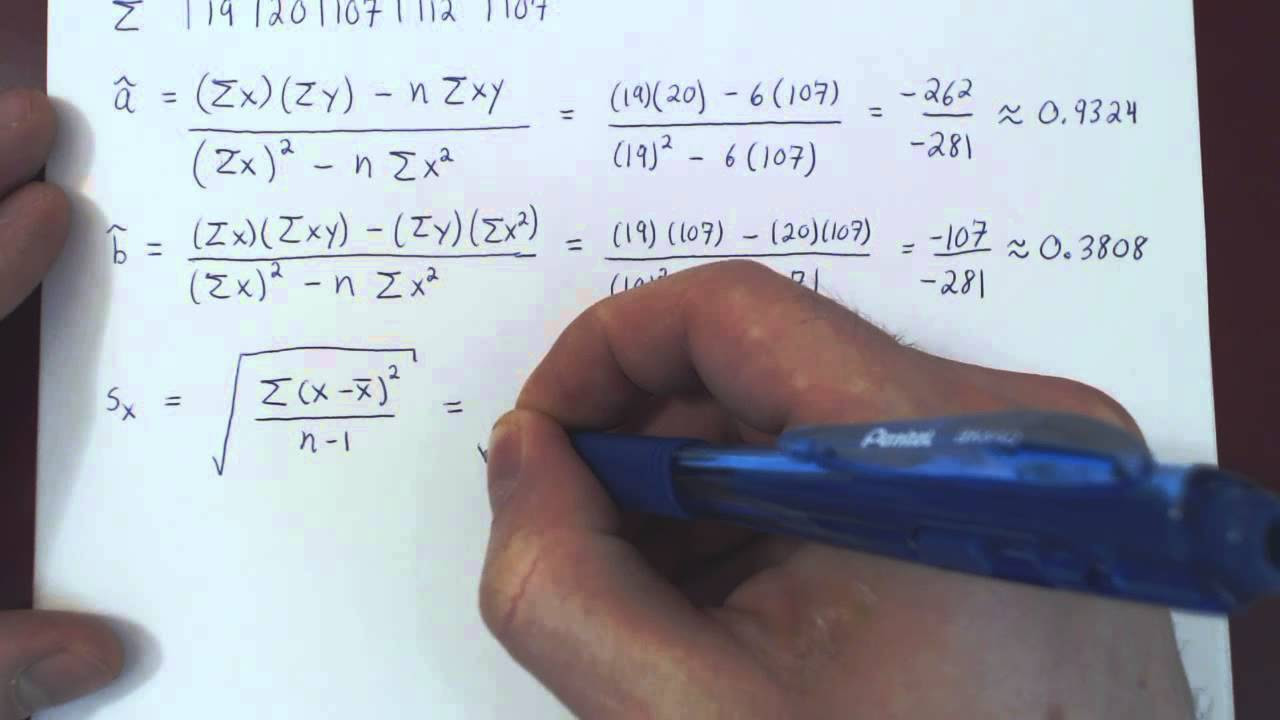
- 📏 The slope m and y-intercept b formulas use these sums to calculate the equation of the best fitting line
- 📈 Excel can quickly calculate the slope and intercept to save time finding the regression equation
- 😊 The line equation can be tested by plugging in x values and checking the predicted y values match the data
- 🧮 The least squares method minimizes the residuals, the differences between the observed y's and predicted y's
- 🔢 Statistics may write the equation as y=b0+b1x where b0 is the intercept and b1 is the slope m
- 🖥 Excel makes finding the regression equation fast when you have x and y data
- ✅ Testing x values in the final equation checks how well it fits the actual data
- 🎥 This process works for finding equations that model trends in experimental data
Q & A
What method is used in the video to find the equation of a line that best fits the data points?
-The video uses the least squares method to find the equation of the best fitting line.
What are the four columns created in the table shown in the video?
-The four columns in the table are: x, y, the product of x and y, and x squared.
What do the variables m and b represent in the linear equation y = mx + b?
-The variable m represents the slope of the line and b represents the y-intercept.
How is the slope m calculated using the provided data?
-The slope m is calculated using the formula: n * sum(xy) - sum(x) * sum(y) / n * sum(x^2) - (sum(x))^2, where n is the number of data points.
What is the purpose of finding the linear equation that best fits the data?
-The purpose is to find an equation that closely approximates the relationship between the x and y variables in the data. This equation can then be used to predict y values for a given x value.
How is the accuracy of the calculated linear equation tested?
-The accuracy is tested by plugging in sample x values and comparing the calculated y values to the actual y values from the original data set. The closer the values, the better the fit.
What are some applications where finding a best fit linear equation would be useful?
-Some applications include: modeling experimental scientific data, analyzing trends and making predictions, interpolating between data points, and more.
What are some benefits of using Excel to find the slope and y-intercept?
-Benefits include: it's faster/more efficient, less manual calculations needed, built-in Excel functions make it simple, and it reduces potential human calculation errors.
What formula does Excel use to calculate the slope?
-Excel uses the SLOPE formula to calculate the slope between two data sets.
What formula does Excel use to calculate the y-intercept?
-Excel uses the INTERCEPT formula to calculate the y-intercept of a line based on known x and y value sets.
Outlines
😀 Introduction to linear regression and least squares method
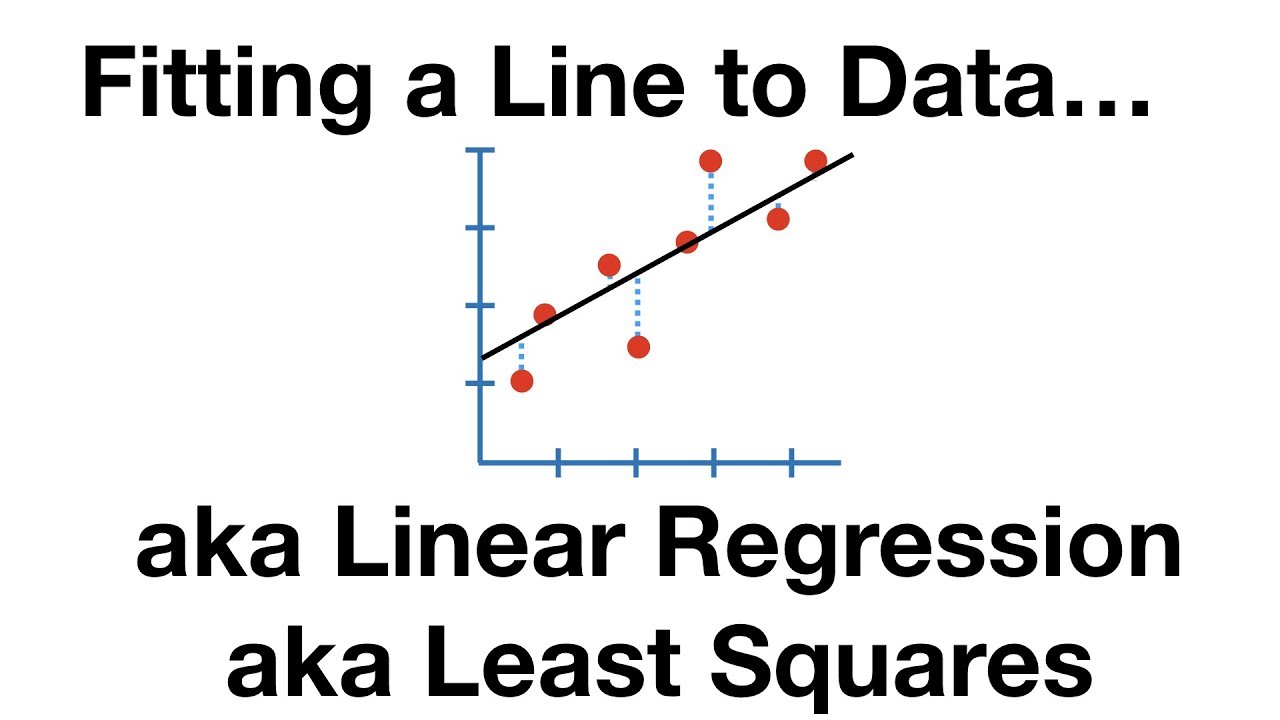
The paragraph introduces the main topic of the video - using linear regression and the least squares method to find the equation of a line that best fits a set of data points. It provides a visual illustration of data points that don't fall perfectly on a line and explains the goal is to calculate an equation for the line that fits the points most closely.
😃 Demonstrating the steps to apply the least squares method
The paragraph walks through the key steps to apply the least squares method, including: creating a table to plot the x and y data points, calculating the sum of x, sum of y, sum of xy, and sum of x squared, using those sums to calculate the slope (m) and y-intercept (b) of the best fit line equation, checking the accuracy of the line against a few data points, and confirming the answer using Excel.
😊 Using Excel to quickly find best fit line equation
The paragraph shows how to use Excel's slope and intercept functions to easily calculate the slope and y-intercept of the best fit line equation. It emphasizes this as a time-saving method compared to doing the calculations manually, which is useful when analyzing data for a science experiment or report.
Mindmap
Keywords
💡linear regression
💡least squares method
💡slope
💡y-intercept
💡linear equation
💡sum of x
💡sum of y
💡sum of xy
💡sum of x^2
💡Excel
Highlights
We'll use the least squares method to find the equation of the line that best fits the data points
We'll create a table with columns for x, y, xy, and x^2 to help calculate the slope and y-intercept
The slope m is equal to b1 in statistics terminology
The y-intercept b is equal to b0 in statistics
The slope formula uses the sums of x, y, xy, and x^2 values
The y-intercept formula uses the slope m, sums of x and y values
Plugging in x values into the equation gives good approximations of the y values
Excel can quickly calculate the slope and y-intercept
The Excel SLOPE and INTERCEPT functions use the x and y data
The linear equation fits the observed data very well
This approach is useful for writing equations that describe experimental data
The least squares method performs linear regression
The linear equation is in slope-intercept form
Statistics terminology uses b0 and b1 instead of b and m
Excel saves time in calculating linear regression parameters
Transcripts
Browse More Related Video

Scatter Plots and Lines of Best Fit By Hand
Linear Regression and Correlation - Example
The Main Ideas of Fitting a Line to Data (The Main Ideas of Least Squares and Linear Regression.)
Input a table of values into a Graphing Calculator and construct a line

Regression and R-Squared (2.2)

Linear Functions
5.0 / 5 (0 votes)
Thanks for rating: