Measures of Spread: Crash Course Statistics #4
TLDRThis video explains statistical measures of spread, which indicate how dispersed data is around a central value. It discusses range, interquartile range, variance, and standard deviation, explaining how each measure provides insights into data variation. The video explores real-world examples like analyzing a YouTube audience's age range to understand one's core viewers. It concludes that comparing oneself only to averages can be misleading without considering data spread, encouraging people to calculate standard deviations for a more nuanced comparison.
Takeaways
- 😀 Measures of spread tell us how data is distributed around the middle, letting us know how well the mean/median represent the data
- 👍 Range takes the largest number and subtracts the smallest number to quantify the distance between the most extreme points
- 📈 Interquartile range looks at the spread of the middle 50% of data, better summarizing the core audience
- 📊 Variance helps understand how spread out the whole dataset is by squaring the deviations from the mean
- 🔢 Standard deviation measures average deviation from the mean, making variance more interpretable
- 🤔 Extreme values can strongly influence measures like means, while medians stay more stable
- 🔭 Comparing yourself only to averages can be misleading without considering how spread out the data is
- 👀 Measures of spread give information about the diversity of a dataset - useful for YouTube growth!
- ✅ Standard deviation increasing shows attracting a more diverse, "spread out" audience
- 💡 Don't just compare yourself to averages - calculate spreads too to fully understand rankings
Q & A
What does the range tell us about a data set?
-The range tells us the distance between the largest and smallest numbers in a data set. It quantifies the distance between the most extreme points.
How is the interquartile range different from the overall range?
-The interquartile range only looks at the middle 50% of the data, ignoring the extreme high and low values. It gives a sense of the spread for the core audience or group.
Why do we calculate sample variance differently than population variance?
-We divide the sample variance by n-1 rather than n to make it an unbiased estimate of the population variance.
What are the units of variance and why don't they make intuitive sense?
-The units of variance are the squared units of the original data (e.g. seconds squared). This doesn't allow for an intuitive interpretation.
How does standard deviation relate to variance and what are its units?
-The standard deviation is the square root of the variance. This gives units that make more sense, like seconds or wins.
How can you use standard deviation to understand the accuracy of a mean?
-A small standard deviation relative to the mean suggests the mean is an accurate summary statistic. A large standard deviation suggests the mean may not represent the data well.
Why would a YouTuber care about the standard deviation of viewer ages?
-It indicates whether their audience skews young or old or whether it's diverse across age groups. This helps shape content decisions.
How can extreme values influence measures of spread?
-Extreme high or low values can greatly expand measures like range and standard deviation. The mean moves towards them as well.
What's the takeaway about comparing yourself to averages?
-The 'average' alone can be misleading. Considering the standard deviation gives you a better sense of variability and whether the average is truly typical.
What are some real world uses for measures of spread?
-Economists use them to study income inequality, investors use them to identify price bubbles, pollsters use them to calculate margin of error.
Outlines
😃 Introducing Key Statistical Concepts
Paragraph 1 introduces and defines important statistical concepts related to measures of spread or dispersion of data, including range, interquartile range, variance, and standard deviation. It highlights why these concepts are valuable for understanding data distributions and interpreting summary statistics like the mean.
�decided Calculating Variance and Standard Deviation
Paragraph 2 provides a step-by-step explanation of how to calculate variance and standard deviation, using a baseball example with team win totals. It explains why variance uses squared units and how standard deviation converts variance back to the original units for easier interpretation.
🌟 Applying Measures of Spread to YouTube Analytics
Paragraph 3 continues the YouTube channel example to demonstrate how measures of spread like standard deviation can provide insight into audience diversity. As the channel attracts more varied age groups, the standard deviation of viewer ages increases, indicating a less concentrated distribution.
Mindmap
Keywords
💡statistics
💡measures of spread
💡range
💡interquartile range (IQR)
💡variance
💡standard deviation
💡outlier
💡YouTube
💡average
💡spread
Highlights
Measures of spread tell us how data is spread around the middle, letting us know how well the mean or median represents the data.
Range takes the largest number in our data set and subtracts the smallest number to give the distance between these two extremes.
The IQR looks at the spread of the middle 50% of your data, giving a better idea of the primary group in your audience.
Variance can give us a better sense of how spread out the whole data set is.
The standard deviation is the average amount we expect a point to differ from the mean.
If you see a mean number reported, you can use the standard deviation to understand how well it represents the data.
As your standard deviation gets larger, it means you're attracting a more diverse, "spread out" audience.
Don't just compare yourself to the average - calculate the standard deviation too for proper context.
Measures of spread quantified the distance between extreme points in our data.
The median changes less than the mean when removing extreme values.
Variance shows how far each data point is from the mean.
Standard deviation gives variance units that make more sense.
A small standard deviation means 307 murders is a good guess per state.
A large standard deviation of 353 means 307 murders is not a good guess per state.
Measuring the spread helps determine how well measures of center represent the data.
Transcripts
Browse More Related Video
Range, variance and standard deviation as measures of dispersion | Khan Academy
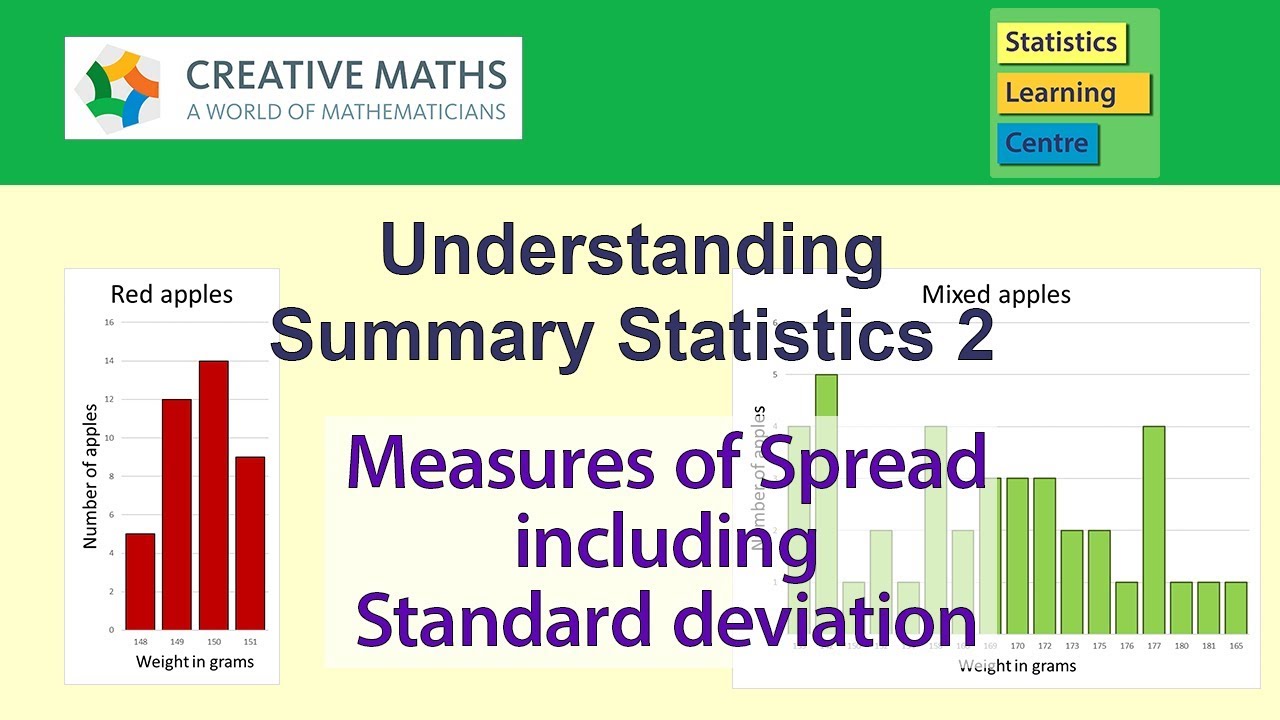
Understanding Standard deviation and other measures of spread in statistics

Descriptive Statistics [Simply explained]
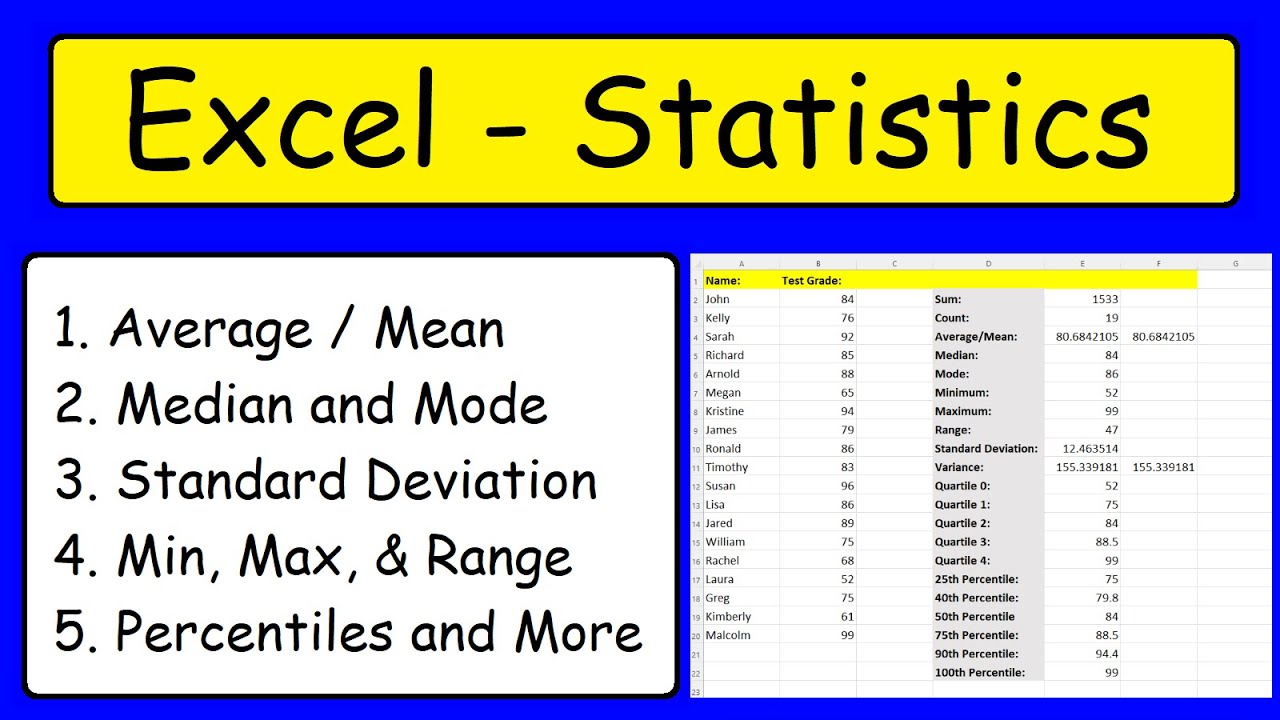
Statistics - Excel
Measures of Spread & Variability: Range, Variance, SD, etc| Statistics Tutorial | MarinStatsLectures

Mode, Median, Mean, Range, and Standard Deviation (1.3)
5.0 / 5 (0 votes)
Thanks for rating: