The Shape of Data: Distributions: Crash Course Statistics #7
TLDRThis video explains how the shape and distribution of data samples can provide insights into the larger data sets they represent. It discusses different types of distributions like normal, skewed, multimodal, and uniform. Comparing distribution shapes helps determine if samples come from the same generative process and make inferences about the world. Statistics allows us to examine samples, with their uncertainty, and guess at the true underlying distributions that created them.
Takeaways
- 😀 Samples give us a glimpse of the bigger picture and tell us something about the shape of all the data
- 👨🏫 Distributions represent all possible values for a set of data and how often those values occur
- 📊 The shape of a normal distribution is set by the mean and standard deviation
- ✏️ Data is often skewed with extreme values on one side rather than symmetric
- 😮 Bimodal or multimodal data has two or more peaks and may come from two hidden distributions
- 🎲 Uniform distributions have the same frequency for each value, like numbers on a die
- 🔍 The shape of sample data gives us clues about the true underlying distribution
- 🤔 We use statistics to make decisions when we are uncertain, based on patterns in sample data
- 🚦 Comparing sample shapes helps us figure out if they come from the same distribution
- 🎯 The shape of data gives us insight into what's really happening in the world
Q & A
What is a distribution in statistics?
-A distribution represents all possible values for a set of data and how often those values occur. Distributions show the shape and spread of data.
How does a sample relate to a distribution?
-A sample gives us a glimpse of what the distribution might look like for the full data set. We collect samples because we think they will tell us something about the shape of all the data.
What are some common shapes of distributions?
-Some common distribution shapes are normal (symmetric, bell curve), skewed (with a long tail on one side), bimodal (two peaks), and uniform (all values equally likely).
What does the normal distribution look like?
-The normal distribution is symmetric and bell-shaped. It has a single peak at the mean, with 68% of values within 1 standard deviation of the mean.
How can you identify skewed distributions?
-Skewed distributions have a long tail on one side. In the box plot, the median will not split the box in half. There may also be more outliers on the skewed side.
What causes bimodal distributions?
-Bimodal distributions have two peaks and often occur when there are two groups being measured together, possibly with two underlying distributions.
What is a uniform distribution?
-In a uniform distribution, each value has an equal chance of occurring, like the numbers on a die roll. Samples may not look perfectly uniform but we know the underlying distribution is.
Why do we care about distribution shapes?
-The shape of a distribution gives us information about what generated the data. Different shapes imply different data generating processes.
How do you set a normal distribution?
-A normal distribution is set by its mean, which defines the center, and its standard deviation, which defines how spread out it is.
What does comparing distribution shapes allow us to do?
-By comparing the shapes of samples, we can make inferences about whether the underlying distributions that generated them are different or the same.
Outlines
😃 Introducing Data Distributions and Their Shapes
This paragraph introduces the concept of data distributions, which represent all possible values for a data set and how often those values occur. It explains that distributions can be visualized as histograms with narrow bins to create a smooth curve, and discusses discrete vs continuous distributions. The distribution acts as instructions for a data generating machine, specifying how the data is shaped.
😊 Exploring Common Distribution Shapes
This paragraph explores some of the most common distribution shapes, starting with the normal/bell curve distribution. It explains how the normal distribution is symmetric and unimodal, and how its shape is determined by the mean and standard deviation. It then discusses skewed distributions, comparing the shapes of two sample test score distributions. Finally, it introduces bimodal and multimodal distributions, as well as the uniform distribution.
🤓 Using Statistics to Understand Distributions
This concluding paragraph explains how statistics allows us to make inferences about the true underlying distribution that generated a sample of data, despite randomness and uncertainty. It gives examples of using distribution shapes for real-world tasks like determining if a die is loaded. It emphasizes that the goal is to glimpse the true nature of what's happening in the world.
Mindmap
Keywords
💡distribution
💡sample
💡histogram
💡normal distribution
💡skewed distribution
💡bimodal distribution
💡uniform distribution
💡statistics
💡shape
💡random
Highlights
Samples and the shapes they give us are shadows of what all the data would look like.
We collect samples because we think they’ll give us a glimpse of the bigger picture.
It turns out we can learn almost everything we need to know about data from its shape.
A distribution represents all possible values for a set of data and how often those values occur.
The shape of a normal distribution is set by two familiar statistics: the mean and standard deviation.
Skew can be a useful way to compare data.
Answering whether one distribution could have produced two samples gets complicated, but we’ll get there.
Often when you see multimodal data in the world it’s because there are two different machines with two different distributions that are both generating data.
While we don’t know for sure that bimodal data is secretly two distributions disguised as one, it is a good reason to look at things more closely.
There’s a difference between the shape of all the data, and the shape of a sample of the data.
Using statistics allow us to take the shape of samples that has some randomness and uncertainty, and make a guess about the true distribution that created that sample of data.
Whether it’s finding the true distribution of eruption times at Old Faithful, or showing evidence that a company is discriminating based on age, gender, or race, the shape of data gives us a glimpse into the true nature of what is happening in the world.
Picture a histogram of every single person’s height. Now imagine the bars getting thinner and thinner as the bins get smaller and smaller. Till they are so thin that the outline of our histogram looks like a smooth line since there’s an infinite possibility of heights.
If we let our bars be infinitely small, we get a smooth curve, also known as the distribution, of the data.
We’ll have a skinnier normal distribution. Most of the data in the normal distribution—about 68%—is within 1 standard deviation of the mean on either side.
Transcripts
Browse More Related Video

01 - Sampling Distributions - Learn Statistical Sampling (Statistics Course)
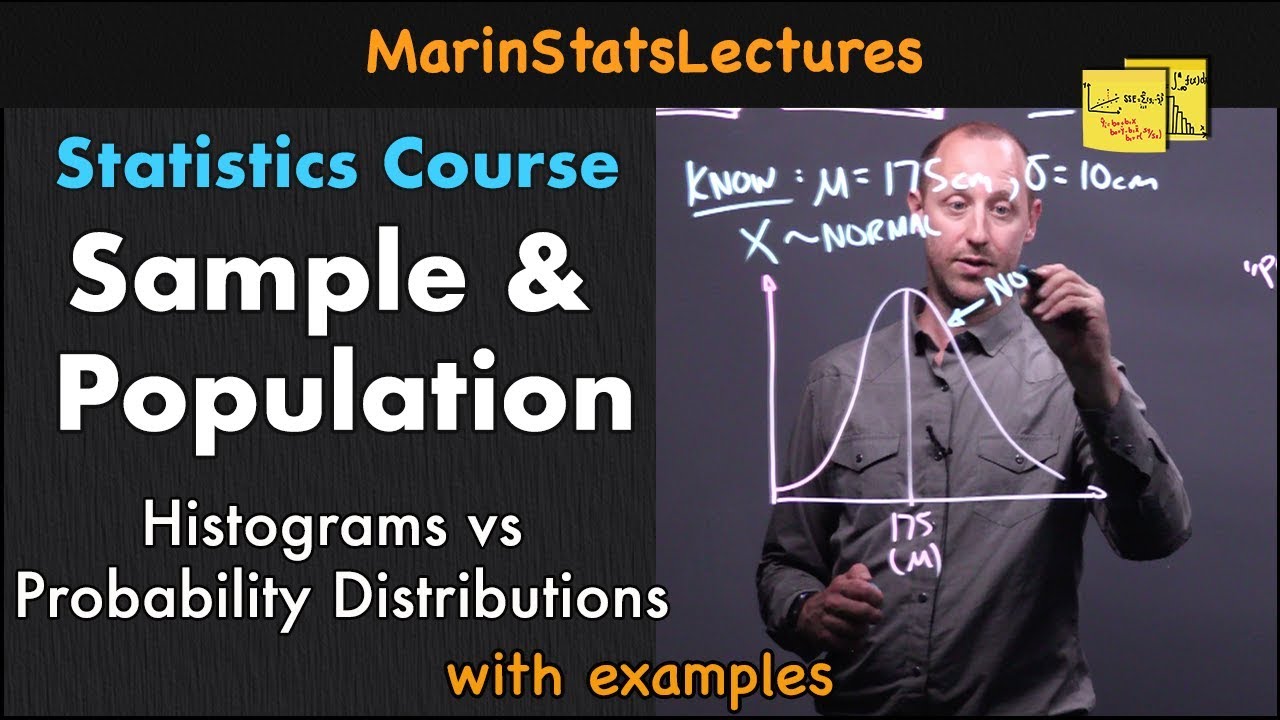
Sample and Population in Statistics | Statistics Tutorial | MarinStatsLectures
Sampling distribution of the sample mean | Probability and Statistics | Khan Academy
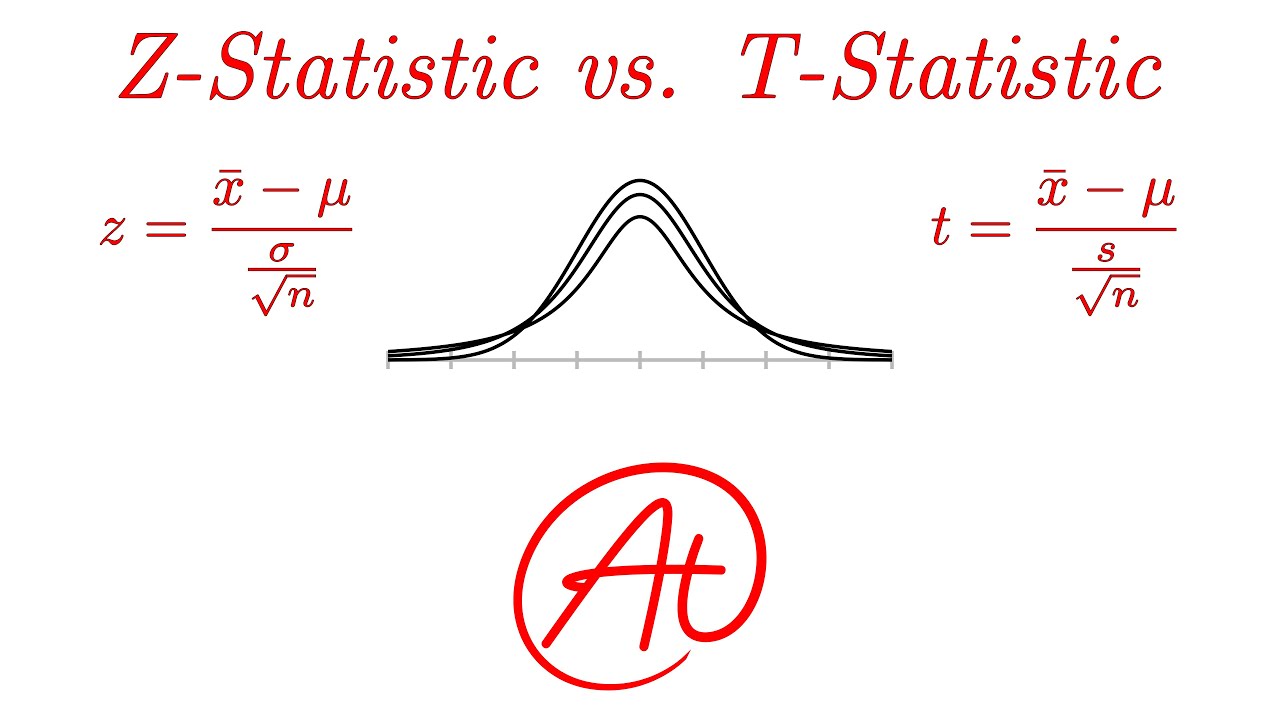
Z-Statistics vs. T-Statistics EXPLAINED in 4 Minutes

Probability: Types of Distributions
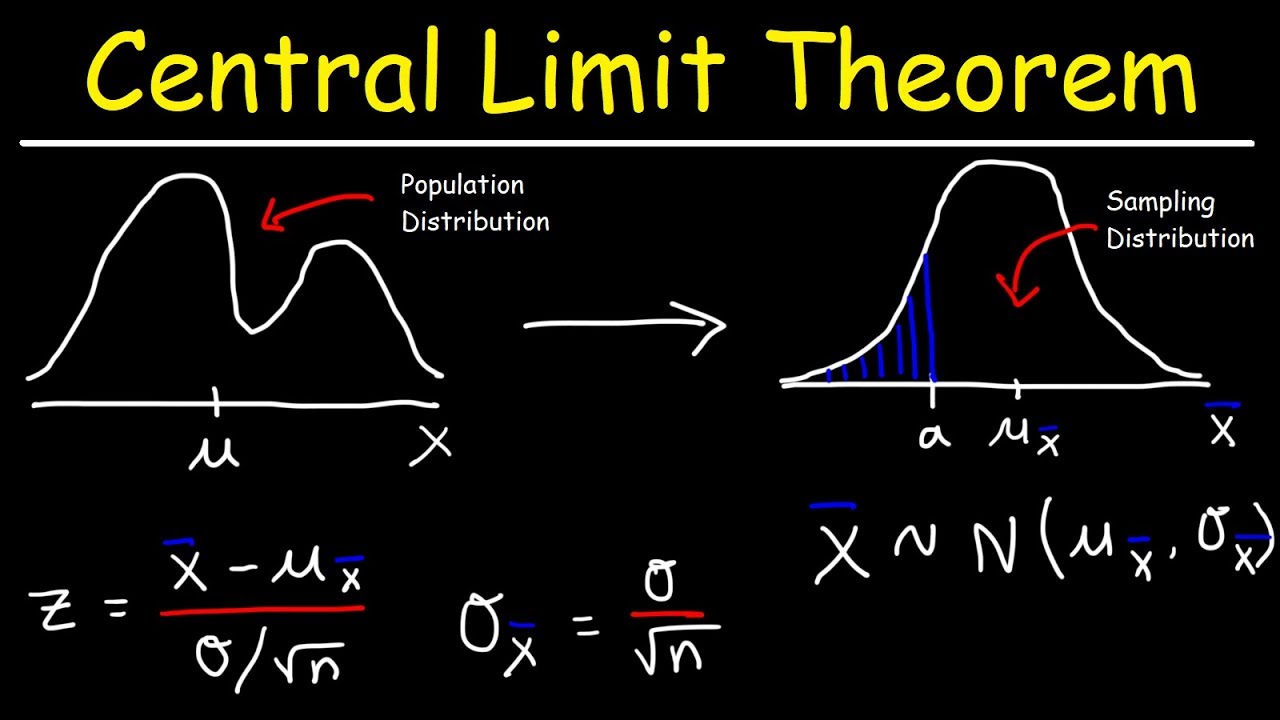
Central Limit Theorem - Sampling Distribution of Sample Means - Stats & Probability
5.0 / 5 (0 votes)
Thanks for rating: