Randomness: Crash Course Statistics #17
TLDRThe script discusses the concept of randomness and how statistics helps us understand and quantify randomness. It explores simulations as a way to model random processes like the weight of a McDonald's fries order. Concepts like expectation, variance, skewness and kurtosis are introduced to characterize distributions. Formulas are provided to calculate these quantities. Adding independent random variables is discussed, along with how the mean and variance of the sum equal the sum of the means and variances. Overall the script conveys how statistics gives us valuable information about randomness to help guide better decision making.
Takeaways
- 😀 Randomness is common in daily life, from dice rolls to subway riders.
- 👉 Simulations allow us to explore possible outcomes of random processes.
- 😊 The mean or expected value tells us what we expect from random data overall.
- 📊 Variance describes how spread out random data is expected to be.
- 🎯 Higher moments like skewness and kurtosis give more info about distributions.
- 🔢 The mean of the sum of independent variables is the sum of their means.
- 🤓 Statistics helps us understand and work with randomness and unpredictability.
- 🍟 A simulation showed weight of McDonald's fries is normally distributed around 168g.
- 😕 High variance means the mean is less reliable for things like party soda estimates.
- 🎲 Adding dice rolls keeps the same shape but shifts mean and increases variance.
Q & A
What does randomness refer to in the context of statistics?
-Randomness refers to uncertainty and the inability to predict specific outcomes, even though we may know something about the general behavior of the random process.
How can simulations help us understand random variables?
-Simulations allow us to explore outcomes that didn't actually happen but could have happened. By simulating a random process many times, we can understand its general behavior.
What is the expected value or mean of a distribution?
-The expected value or mean is the value we expect to get on average from the distribution. It represents the center of the distribution.
How is variance calculated and what does it tell us?
-Variance is calculated by taking the expectation of the squared differences from the mean. It tells us how spread out the data is and how reliable the mean is.
What is skewness and what does it measure?
-Skewness measures asymmetry in the distribution. Positive skewness means there are more extreme values above the mean. Negative skewness indicates more extreme values below the mean.
What is kurtosis measuring?
-Kurtosis measures how heavy the tails of the distribution are - how common it is to get extreme outlier values far from the mean.
How can we calculate the mean and variance for the sum of independent random variables?
-The mean of the sum is the sum of the means. The variance of the sum is the sum of the variances. This allows easy calculation for combinations of distributions.
How do the moments help characterize a distribution?
-The first moment is the mean, which locates the distribution. Higher moments like variance, skewness and kurtosis describe the shape and spread of the distribution.
What are some examples of randomness in everyday life?
-Examples include dice rolls, card draws, subway ridership, how long you have to wait for parking, and whether it rains when you bring an umbrella.
How can statistics help us understand randomness?
-Statistics gives us tools like expectation, variance, and simulations to quantify randomness and make informed choices despite uncertainty.
Outlines
📊 Introducing Randomness and Expectation in Statistics
This paragraph introduces the concept of randomness in statistics. It discusses how many things in life have an element of randomness, using examples like fries weights at McDonald's. It then explains expectation - the value we expect from a random distribution - and how expectation helps characterize randomness, using examples like planning for soda at a party.
😎 Explaining Variance, Skewness and Other Statistical Moments
This paragraph explains other statistical moments beyond expectation that help characterize distributions, including variance, skewness, and kurtosis. Variance measures how spread out the data is, skewness measures asymmetry, and kurtosis measures thickness of tails. These moments give more information about the shape of random distributions.
📈 Summarizing Rules for Sums of Random Variables
This closing paragraph summarizes rules for sums of independent random variables. It states that the mean of the sum is the sum of the means, and the variance of the sum is the sum of the variances. It provides the example of rolling two dice and calculating the mean and variance of the total.
Mindmap
Keywords
💡Randomness
💡Simulation
💡Expectation
💡Variance
💡Skewness
💡Kurtosis
💡Mean
💡Variance
💡Moments
💡Normal distribution
Highlights
Randomness is tied to the idea of uncertainty, like why these fries are here and if they're delicious.
Simulations allow us to explore options that didn’t happen, but could have happened, which is what statistics is all about.
The mean is the amount we expect to get from a random process, called the expected value because it's what we "expect" overall.
Variance tells us how spread out we expect the data to be.
Skewness tells us if there are more extreme values on one side, like income or Vegas winnings which are right skewed.
Kurtosis measures how thick the tails of a distribution are and how common really far values from the mean are.
The mean of the sum is the sum of the means, and the variance of the sum is the sum of the variances for independent variables.
Randomness is why you can’t be sure you’ll win in Vegas or how long you'll wait for parking, but statistics helps us know something about it.
The mean tells us where a distribution is, while other moments describe the shape and spread.
A simulation of 10,000 McDonald's fry orders shows most are around 168 grams, but some are up to 200 grams.
Expected value helps calculate how much of something, like soda, to have based on possible outcomes and probabilities.
Variance counts extreme values equally, while skewness differentiates above and below the mean.
Higher-order moments like skewness and kurtosis provide more information about distributions.
Adding independent random variables, the mean and variance of the sum can be calculated from the components.
Statistics helps evaluate things involving randomness like machine learning algorithms or experiments.
Transcripts
Browse More Related Video
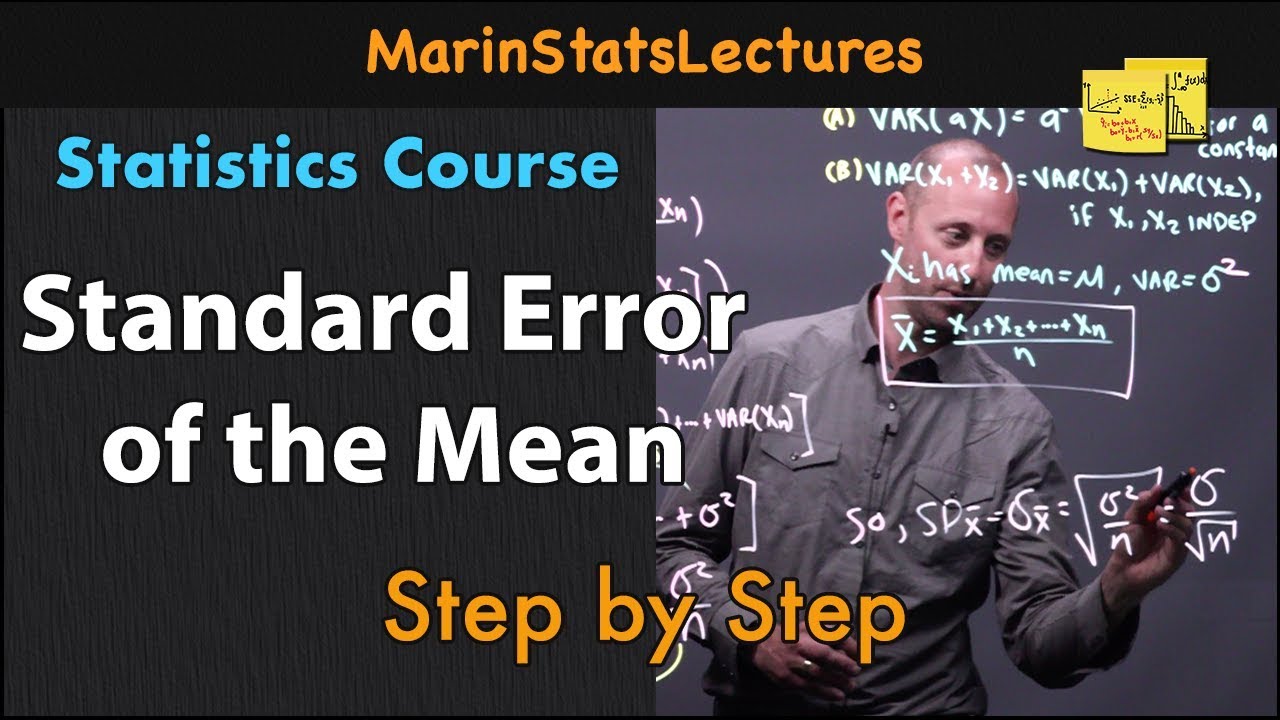
Standard Error of the Mean: Concept and Formula | Statistics Tutorial #6 | MarinStatsLectures
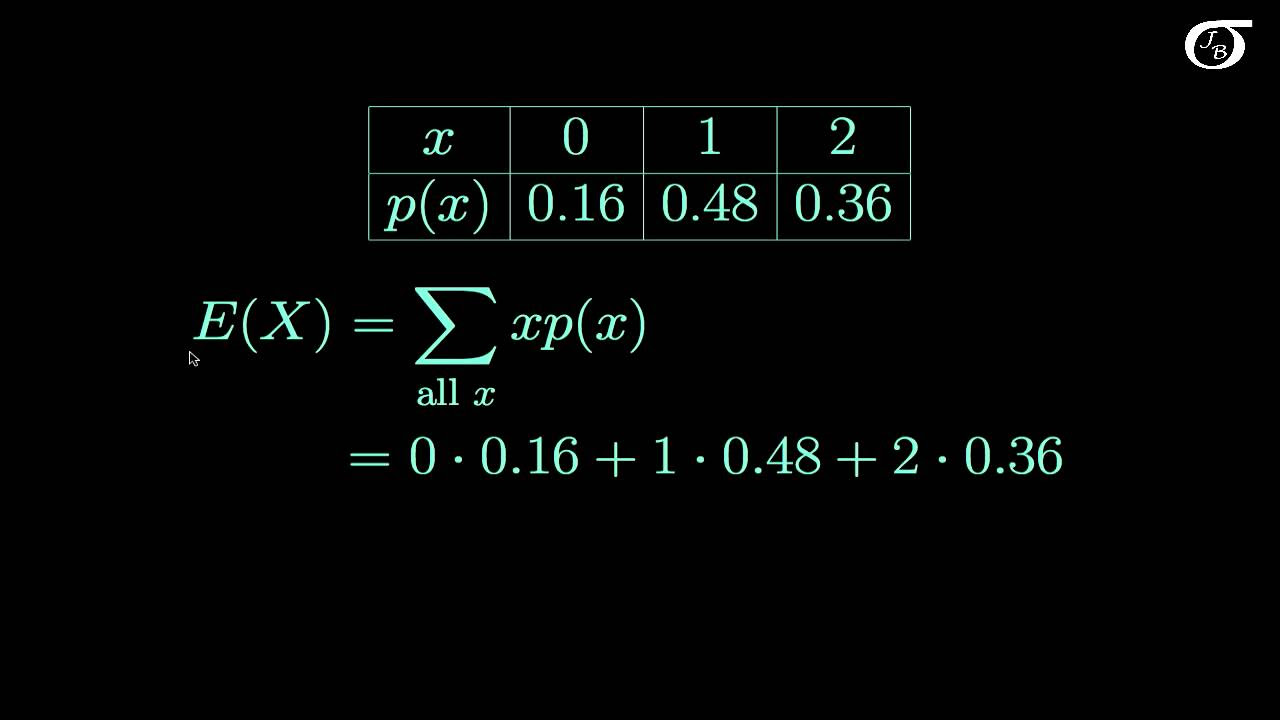
Expected Value and Variance of Discrete Random Variables

Introduction to Descriptive Statistics
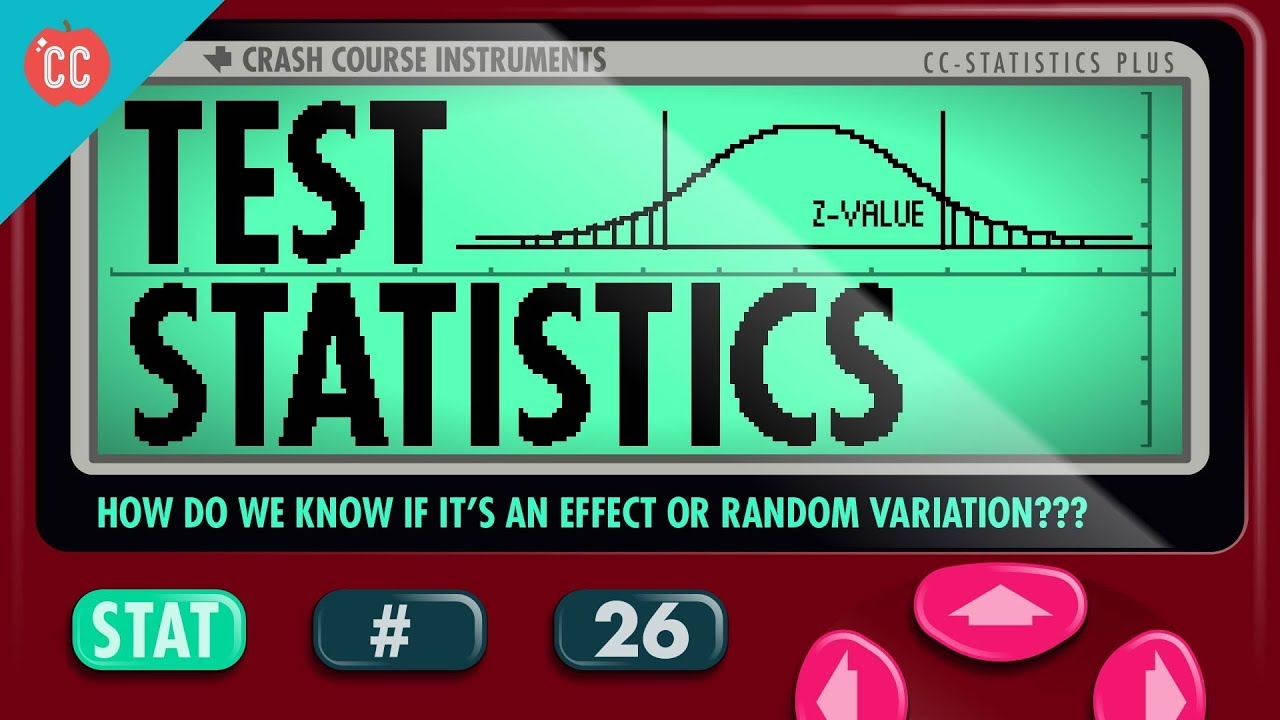
Test Statistics: Crash Course Statistics #26

4. Monte Carlo
Lecture 14: Location, Scale, and LOTUS | Statistics 110
5.0 / 5 (0 votes)
Thanks for rating: