How P-Values Help Us Test Hypotheses: Crash Course Statistics #21
TLDRThe video explains statistical inference, which involves making conclusions about populations based on sample data. A key concept is null hypothesis significance testing: assuming there is no effect or difference in the population and checking if the sample data seems unlikely under this assumption. The rarity of the data is quantified using p-values. If the p-value is below a threshold like 0.05, the null hypothesis is rejected as too unlikely to explain the data. This process has flaws but is commonly used to test ideas and claim statistical significance when data appears too extreme to be random chance.
Takeaways
- 😀 Inferential statistics helps make decisions about hypotheses by taking randomness into account
- 😮 Null hypothesis significance testing assumes a hypothesis is true, then shows it leads to something absurd
- 📊 P-values tell you how likely your data is if the null hypothesis was true
- 🌟 Smaller p-values indicate your data is more "extreme" compared to the null distribution
- 👩🔬 A p-value cutoff (often 0.05) is used to determine if a result is "statistically significant"
- 🎯 Statistical significance just means "unlikely due to chance alone"
- ❓ There's debate around whether 0.05 is the right p-value cutoff
- 😕 P-values are continuous evidence, but NHST forces a binary reject/don't reject decision
- 🦒 Comparing hypotheses by how well they predict data requires specific predictions
- 📈 NHST doesn't compare hypotheses, it only evaluates one at a time
Q & A
What is statistical inference and how does it relate to making decisions about hypotheses?
-Statistical inference tells us how we can go from describing data we already have to making inferences about data we don't have. It allows us to test ideas or hypotheses while taking into account the random variation of samples.
Why can't we just claim an idea or hypothesis is correct without any evidence?
-We need data and evidence to test a hypothesis. Just having an idea or hypothesis without any evidence to back it up is not sufficient to claim it is correct.
What does a p-value indicate in relation to a hypothesis?
-A p-value tells you the probability of getting data that's as extreme as the data you observed if the null hypothesis was true. It answers the question of how "rare" your data is.
What is null hypothesis significance testing?
-Null hypothesis significance testing (NHST) asks you to test a hypothesis that says there is no difference or effect. You assume the null hypothesis is true, collect data, and see if that data is so extreme or rare that you can reject the null hypothesis.
How is the reductio ad absurdum argument used in null hypothesis testing?
-The reductio ad absurdum argument tries to discredit an idea by assuming it's true and then showing a contradiction. In NHST, you assume the null hypothesis is true, collect data, and see if that data contradicts the assumption in an extreme or absurd way.
What does a small p-value indicate about your data?
-A small p-value indicates your data is very rare or extreme compared to what you'd expect if the null hypothesis was true. The smaller the p-value, the more unlikely your data is due to random chance alone.
What does it mean for a result to be statistically significant?
-If a result has a p-value less than a predetermined cutoff (often 0.05), it is considered statistically significant. This means the result is unlikely to occur by random chance alone if the null hypothesis is true.
Why is there disagreement over using 0.05 as the p-value cutoff?
-There is debate over whether 0.05 is an appropriate cutoff for statistical significance. Some think it is too lenient and leads to many false positive results, while others argue it is reasonable. There are good arguments on both sides.
What are some limitations of null hypothesis significance testing?
-Some drawbacks are that NHST doesn't tell you the size or importance of an effect, it depends heavily on sample size, the binary reject/fail-to-reject conclusion is simplistic, and the 0.05 cutoff is arbitrary.
What might be some alternatives to NHST for testing hypotheses?
-Some alternatives are using confidence intervals to estimate effect size, Bayes factors to compare the probability of different hypotheses, and focusing more on parameter estimation rather than strict hypothesis testing.
Outlines
😊 Introducing Statistical Inference
This paragraph introduces the concept of statistical inference, which allows us to make inferences about unavailable data based on the data we have. It talks about the role of uncertainty in statistics and how inferential statistics deals with making decisions under uncertainty. An example is provided about testing whether listening to Mozart improves calculus performance.
😮 Using Null Hypothesis Significance Testing
This paragraph explains the method of Null Hypothesis Significance Testing (NHST). In NHST, you test the null hypothesis that there is no effect or difference. If data suggests the null hypothesis is implausible, it can be rejected. NHST uses a reductio ad absurdum style argument. An example with gene X and calorie intake is provided.
📊 Interpreting P-values and Setting Significance Levels
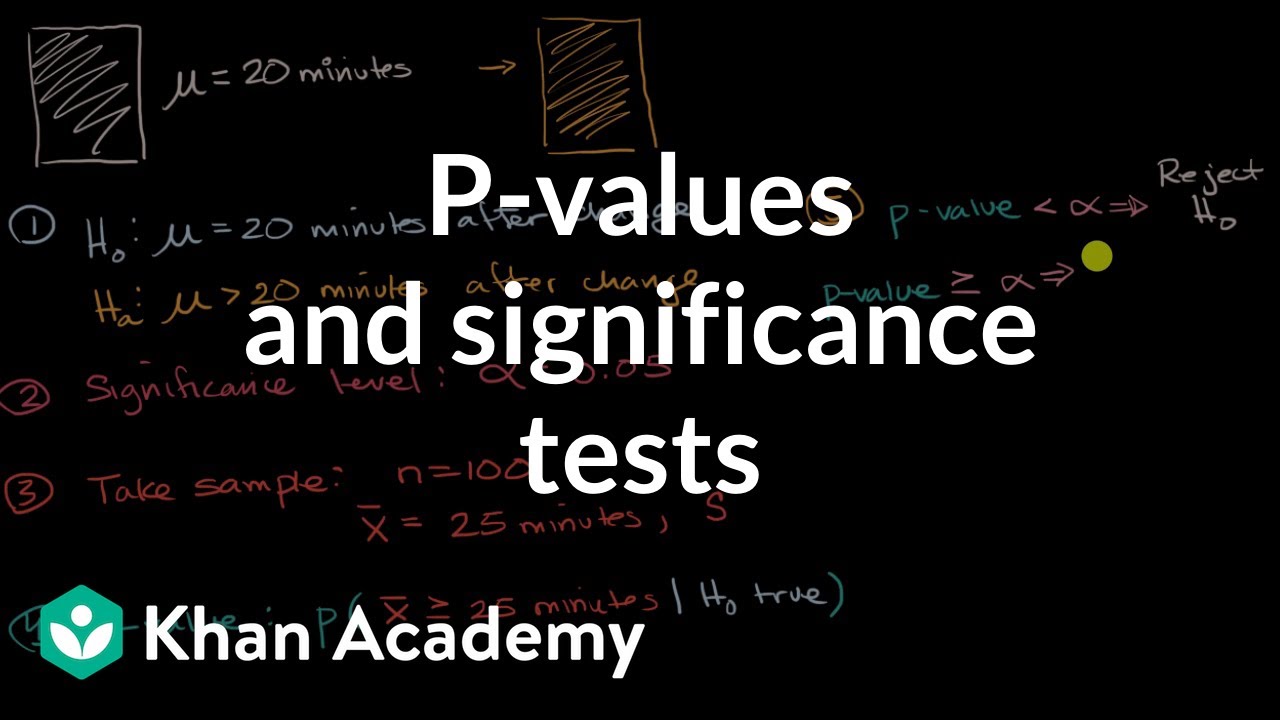
This paragraph discusses p-values, which indicate how likely the observed data would be under the null hypothesis. It talks about one-sided versus two-sided p-values. It then explains the concept of a significance level as a cutoff for small enough p-values to reject the null. Issues with overreliance on 0.05 as the significance level are mentioned.
Mindmap
Keywords
💡hypothesis
💡sample
💡variability
💡null hypothesis
💡p-value
💡statistically significant
💡evidence
💡cutoff
💡random variation
💡generalizability
Highlights
Statistical inference tells us how we can go from describing data we already have to making inferences about data we don't have.
Uncertainty is at the core of what Inferential Statistics is about: making decisions about ideas or hypotheses.
One thing we need for sure is data. So we could randomly sample two groups of 25 people and test our hypothesis.
We need a way to test our hypothesis while taking into account the random variation of sample means.
You can use your data to evaluate which hypothesis or model is more likely to be correct.
Null Hypothesis Significance Testing asks you to test a hypothesis that says there is no difference or effect.
The null hypothesis is that the population mean is the same, e.g. there is no effect of the gene on calorie intake.
If we can show the null hypothesis makes something absurd happen, we can reject the idea that it's true.
A p-value tells you the probability of getting data that's as extreme as what you observed if the null was true.
The smaller the p-value, the more rare your data would be just by random chance if the null hypothesis was true.
You can decide on a p-value cutoff, e.g. 0.05, to determine what counts as evidence against a hypothesis.
When the p-value is below the cutoff, you can reject the null hypothesis. This is called statistical significance.
There is disagreement over whether 0.05 is an appropriate p-value cutoff across all fields.
In NHST, p-values need a cutoff to decide when a result counts as evidence against a hypothesis.
"Statistical significance" just means the result is unlikely due to random chance under the null hypothesis.
Transcripts


5.0 / 5 (0 votes)
Thanks for rating: