P-Value Problems: Crash Course Statistics #22
TLDRThis video explores the logic and controversy around p-values in statistics. It explains how p-values allow us to test hypotheses by quantifying how extreme our observed data would be if the null hypothesis was true. However, p-values have limitations - they don't tell us the probability that the null hypothesis is true, or that we've made an error in rejecting it. We also can't prove the null hypothesis is true by failing to reject it. The video advocates thoughtfully interpreting p-values when reading scientific studies, rather than blindly following standards for what constitutes sufficient evidence to reject a hypothesis.
Takeaways
- 😀 P-values tell us how rare our observed data is, assuming the null hypothesis is true
- 😯 There is disagreement over what p-value cutoff should be used to reject the null hypothesis
- 😕 P-values don't tell us the probability that the null hypothesis is true
- 🤔 P-values give the probability of data given the null hypothesis, not the reverse
- 😞 Rejecting the null doesn't give information about the alternative hypothesis
- 😴 Failing to reject the null doesn't mean accepting it or providing evidence it's true
- 😀 P-values help us make decisions about data and understand people's perception of evidence
- 🤓 We can decide if a study's alpha level is a stringent enough criteria for us
- 😀 P-values allow us to compare the logic of null hypothesis testing with normal reasoning
- 😊 Understanding p-values helps us interpret the results of scientific studies
Q & A
What is a p-value in statistics?
-A p-value tells you how likely you are to get a sample at least as extreme as yours, assuming the null hypothesis is true. It gives you a measure of how surprisingly rare or common your sample results are, if the null hypothesis reflects reality.
Why are p-values controversial?
-P-values are controversial because the standard 0.05 cutoff for significance is arbitrary. Also, p-values don't actually tell you the probability that the null hypothesis is true or false, which is what researchers really want to know.
What is the difference between rejecting the null hypothesis and failing to reject it?
-Rejecting the null means you found strong evidence against it. Failing to reject just means you didn't find strong evidence against it - you can't conclude the null hypothesis is true.
Can a p-value tell you the probability that the null hypothesis is true?
-No, a p-value cannot tell you the probability that the null hypothesis is true. It assumes the null is true, then tells you the chance of getting your data.
What does it mean to fail to reject the null hypothesis?
-Failing to reject the null hypothesis means your data isn't extreme enough to provide good evidence against the null. But it doesn't mean you've shown the null is likely true.
What is an alpha level in hypothesis testing?
-The alpha level, or significance level, is the threshold p-value below which you will reject the null hypothesis. Common values are 0.01, 0.05 or 0.1.
What is the difference between a p-value and a conditional probability?
-A p-value gives you P(data | null is true). A conditional probability gives you P(null is true | data) - the probability of the hypothesis given the data, which is more useful.
What does it mean if I get a p-value of 0.04?
-A p-value of 0.04 means that if the null hypothesis were true, the probability of getting data as extreme or more extreme than yours is 4%. It does not mean there is a 4% chance the null is true.
What are some alternatives to p-values for statistical inference?
-Some alternatives are using confidence intervals, Bayesian inference to directly get probabilities of hypotheses, or focusing more on effect sizes and precision rather than just rejecting null hypotheses.
What should I consider when interpreting p-values from a study?
-Consider the alpha level used, whether it seems appropriate for the context, the study design, sample size, real-world impact if the null was falsely rejected, and if confidence intervals or effect sizes are also reported.
Outlines
📊 What are p-Values and How Should We Interpret Them?
This paragraph explains what p-values are, how they are calculated by assuming the null hypothesis is true, and issues with using p-values to determine statistical significance, including arbitrariness of cutoffs, p-values not telling us the probability we actually want to know, not providing information about the alternative hypothesis, and inability to prove the null hypothesis is true.
❓ Common Misinterpretations and Limitations of p-Values
This paragraph discusses several common issues with interpreting p-values, including that they don't tell you the probability of the null hypothesis being true or the probability you made an error in rejecting the null, and that failing to reject the null doesn't mean accepting it or providing evidence it's true.
🤔 Evaluating Statistical Evidence and Reasoning About the World
This closing paragraph acknowledges the limitations of null hypothesis significance testing in providing evidence for the null hypothesis, discusses an example where we would want to demonstrate the null hypothesis, and emphasizes understanding p-values to compare the logic of NHST to everyday reasoning.
Mindmap
Keywords
💡p-value
💡null hypothesis
💡alpha
💡conditional probability
💡alternative hypothesis
💡misinterpretation
💡significance testing
💡extreme
💡arbitrary
💡conditional probability
Highlights
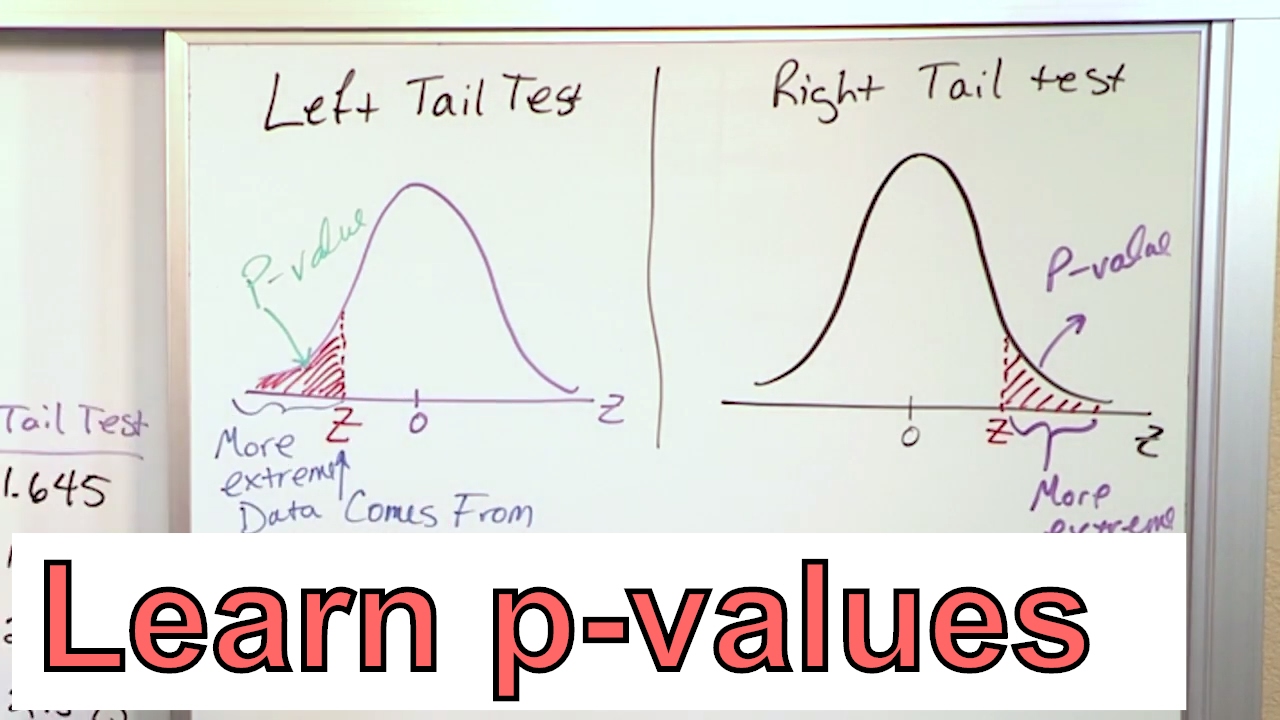
P-values tell us how “rare” something is.
The p-value is the probability of getting a sample as or more extreme than ours, given that the null hypothesis is true.
The standard cutoff for p-values is arbitrary.
A p-value of 0.02 doesn't mean there's a 2% chance the null hypothesis is true.
P-values give the probability of the data given the null hypothesis, not the probability of the null hypothesis given the data.
Failing to reject the null hypothesis doesn’t mean that there isn’t an effect or relationship.
You can’t prove the null hypothesis is true, you can only show you didn’t find evidence it’s false.
The absence of evidence is not the evidence of absence.
P-values can’t tell us anything about the alternative hypothesis other than the means aren't equal.
P-values give insight into how to make decisions about data.
People's perception of evidence can be arbitrary.
You can see the alpha researchers used and decide if it's a stringent enough criteria.
We now know what p-values are and how to interpret them.
This helps us compare the logic of null hypothesis testing with normal reasoning.
P-values give insight but can be perplexing.
Transcripts
Browse More Related Video

05 - Using P-Values in Hypothesis Testing (Compare P Value to Level of Significance)
Calculate the P-Value in Statistics - Formula to Find the P-Value in Hypothesis Testing

What is p-value? How we decide on our confidence level.
Statistical Significance and p-Values Explained Intuitively

What is a p-value?

p-value - easily explained with an example
5.0 / 5 (0 votes)
Thanks for rating: