9.1.1 Two Proportions - Rationale Behind Hypothesis Tests Involving Two Proportions
TLDRThis video script delves into the rationale behind the p-value and critical value methods for testing claims about two proportions. It outlines the hypothesis testing procedure, emphasizing the importance of understanding sampling distributions of p-hat and the pooled sample proportion. The script reviews the normal approximation to the binomial distribution for hypothesis testing, discusses the requirements for testing, and guides viewers through the process of calculating the test statistic and making decisions based on p-values or critical values. The goal is to determine if there is enough evidence to reject the null hypothesis that the proportions are equal.
Takeaways
- 📚 The video discusses the rationale behind the p-value method and critical value method for testing claims about two proportions, focusing on understanding the process rather than applying it to a specific hypothesis test.
- 🔍 It outlines the basic procedure for hypothesis testing, emphasizing the importance of comparing two groups in research, such as differences in behavior between men and women.
- 📈 The script reviews the sampling distribution of the sample proportion (p-hat), explaining how it can be normally distributed under certain conditions and how to calculate its mean and standard deviation.
- 🧐 The video explains the concept of the pooled sample proportion, which is used as an estimate for the common value of p1 and p2 when the null hypothesis is assumed to be true.
- 📝 The importance of checking the requirements for testing claims about two proportions is highlighted, including having two simple random samples that are independent and having at least five successes and failures in each sample.
- 📉 The process of hypothesis testing is detailed, starting with writing the claim symbolically, inferring the null and alternative hypotheses, identifying or computing sample proportions and sizes, and graphing the sampling distribution of p1 hat minus p2 hat.
- 📊 The video describes how to compute the test statistic z for the difference between sample proportions, using the pooled sample proportion to estimate the standard deviation under the null hypothesis.
- 🤔 The script explains the decision-making process in hypothesis testing, involving the comparison of the p-value or test statistic to the significance level alpha to decide whether to reject the null hypothesis.
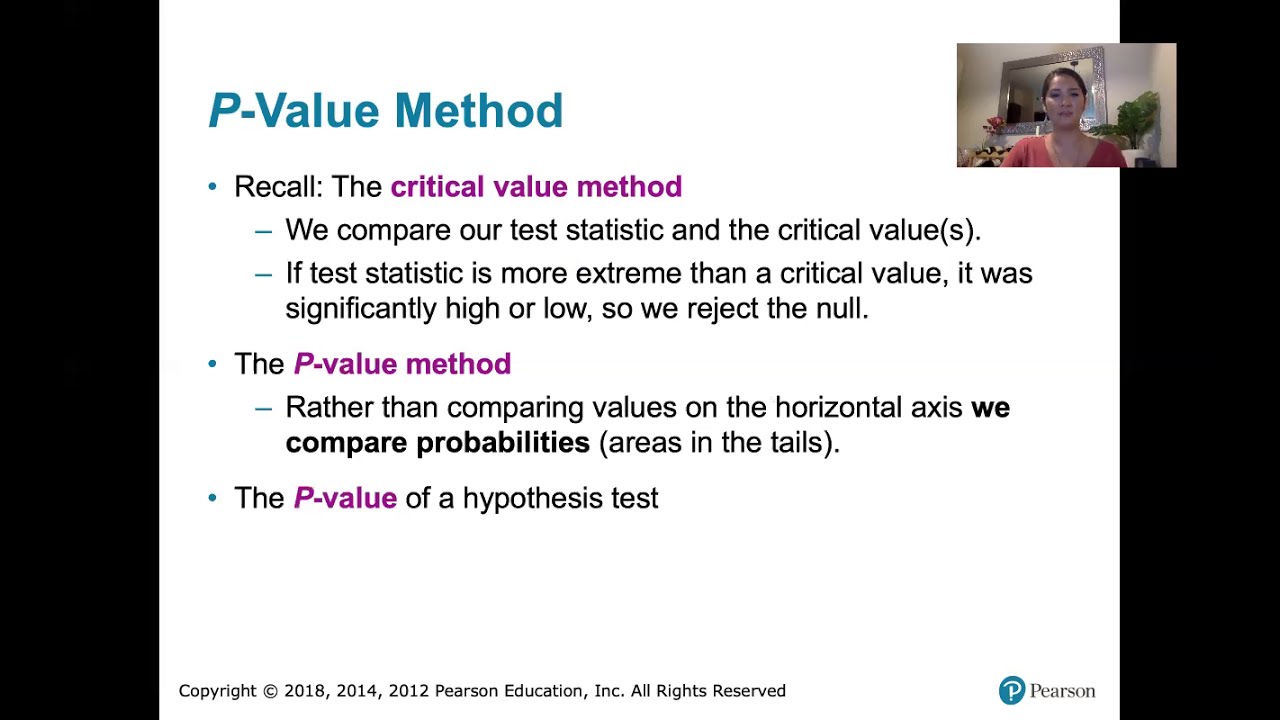
- 📉 The difference between the p-value method and the critical value method is clarified, with both methods relying on the test statistic z and the standard normal distribution for decision-making.
- 🔑 The video emphasizes the importance of stating the conclusion of the hypothesis test in non-technical terms, relating it back to the original claim to make it understandable for a general audience.
- 🔍 The script provides a comprehensive overview of the concepts and steps involved in testing claims about two proportions, preparing viewers for applying these methods in practical scenarios.
Q & A
What is the main topic of the video?
-The main topic of the video is learning about hypothesis testing for claims about two proportions using the p-value method and critical value method.
What is the difference between the p-value method and the critical value method in hypothesis testing?
-The p-value method involves calculating the probability of observing a test statistic as extreme as, or more extreme than, the one obtained from the sample data under the null hypothesis. The critical value method involves comparing the test statistic to a threshold value (critical value) determined by the significance level to decide whether to reject the null hypothesis.
What is the rationale behind using the pooled sample proportion in hypothesis testing involving two proportions?
-The pooled sample proportion is used because it provides an estimate of the common value of p1 and p2 when assuming the null hypothesis is true, which states that the two population proportions are equal.
What is the basic procedure for hypothesis testing involving two proportions?
-The basic procedure includes checking the requirements for testing, stating the null and alternative hypotheses, identifying or computing sample proportions and sample sizes, graphing the sampling distribution of the difference between sample proportions, computing the test statistic, and then applying either the p-value method or the critical value method to make a decision about the null hypothesis.
Why is it important to compare two groups using statistics and hypothesis tests?
-Comparing two groups using statistics and hypothesis tests is important in research to make informed conclusions about differences between populations, such as behavioral differences between genders, which can be statistically significant and not just due to random chance.
What are the conditions under which the sampling distribution of the sample proportion (p-hat) is approximately normally distributed?
-The sampling distribution of the sample proportion (p-hat) is approximately normally distributed under certain conditions, such as when the sample size is large enough and when both p1 hat and p2 hat are independent and can be approximated by a normal distribution.
How is the mean of the sampling distribution of p-hat related to the population proportion p?
-The mean of the sampling distribution of p-hat is equal to the population proportion p, making p-hat an unbiased estimator of the population proportion.
What is the formula for calculating the standard deviation of the sampling distribution of p1 hat minus p2 hat?
-The standard deviation of the sampling distribution of p1 hat minus p2 hat is calculated as the square root of ((p1*q1/n1) + (p2*q2/n2)), where p1 and p2 are the population proportions, q1 and q2 are their complements, and n1 and n2 are the sample sizes.
What are the requirements for using a normal approximation to the binomial distribution in hypothesis testing involving two proportions?
-The requirements include having two simple random samples, the samples being independent of each other, and having at least five successes and five failures in each sample.
How is the pooled sample proportion (p bar) calculated and why is it used in hypothesis testing?
-The pooled sample proportion (p bar) is calculated as (x1 + x2) / (n1 + n2), where x1 and x2 are the number of successes in each sample, and n1 and n2 are the sample sizes. It is used in hypothesis testing as an estimate of the common value of p1 and p2 when the null hypothesis is assumed to be true.
Outlines
📚 Introduction to Hypothesis Testing for Proportions
This paragraph introduces the topic of hypothesis testing for two proportions, explaining the rationale behind the p-value and critical value methods. It sets the stage for the video by outlining the goal of describing the test statistic and the pooled sample proportion. The importance of hypothesis testing in comparing two groups is emphasized, with an example of gender-based behavior comparison. The video's focus is on understanding the concepts behind hypothesis testing rather than applying the methods. The paragraph also reviews the sampling distribution of sample proportions, setting the foundation for further discussion on hypothesis testing.
🔍 Reviewing Sampling Distributions and Notation
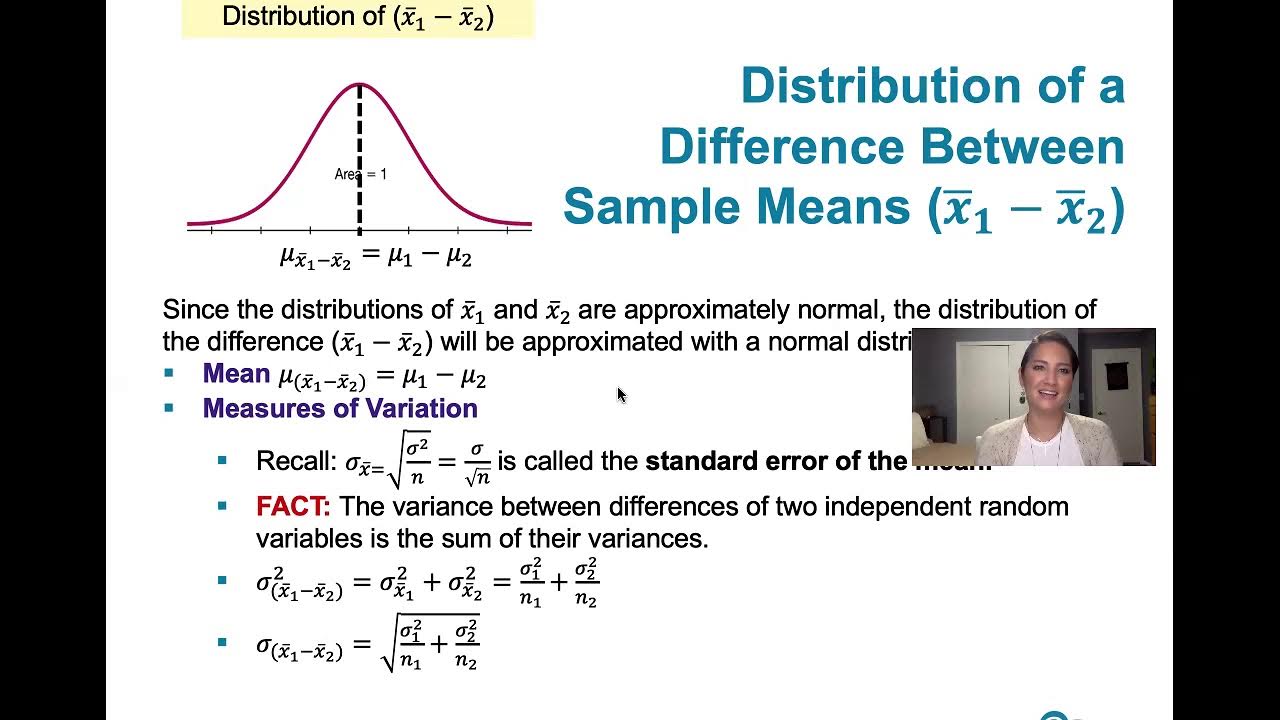
The second paragraph reviews the concept of sampling distributions, specifically focusing on the distribution of sample proportions (p-hat). It explains how the mean and standard deviation of this distribution can be determined and the conditions under which the distribution is normally distributed. The paragraph also introduces the notation used for population proportions and sample statistics, laying the groundwork for understanding the sampling distribution of the difference between two sample proportions (p1-hat and p2-hat). The variance and standard deviation of the difference between these proportions are derived, assuming the samples are independent and large enough to meet the normal approximation criteria.
📉 Requirements and Procedure for Hypothesis Testing
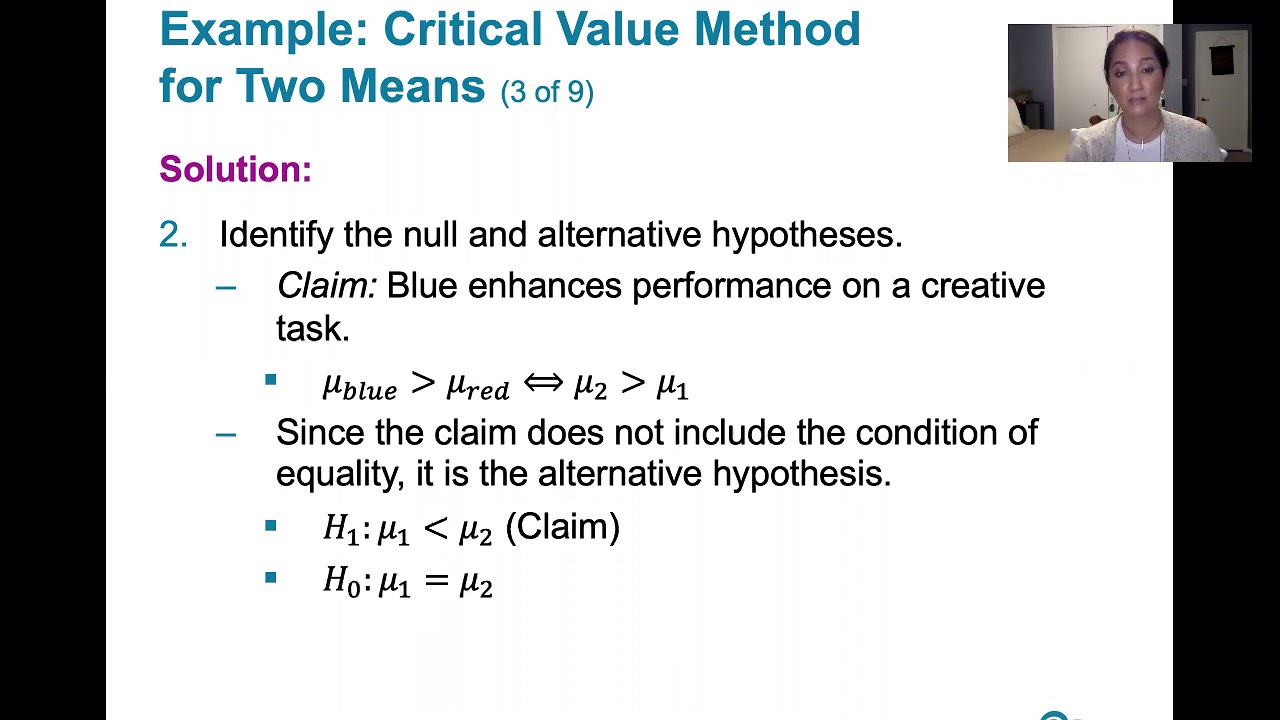
This paragraph discusses the prerequisites for conducting hypothesis tests on two proportions, including the need for two independent simple random samples and a minimum of five successes and failures in each sample. It then outlines the steps involved in hypothesis testing: stating the null and alternative hypotheses, identifying or calculating sample proportions and sizes, and graphing the sampling distribution of p1-hat minus p2-hat under the null hypothesis. The paragraph emphasizes the importance of understanding the process and the implications of the null hypothesis on the mean and standard deviation of the sampling distribution.
🧬 Pooled Sample Proportion and Hypothesis Testing
The fourth paragraph delves into the concept of the pooled sample proportion, which is used when assuming the null hypothesis that the population proportions are equal. It explains how to calculate the pooled proportion (p-bar) and the rationale behind using it as an estimate for the common value of p1 and p2. The paragraph also discusses how this assumption affects the mean and standard deviation of the sampling distribution of p1-hat minus p2-hat, which are crucial for computing the test statistic and making decisions about the null hypothesis.
📊 Interpreting Test Statistics and Decision Making
This paragraph explains how to interpret the test statistic (z-score) in the context of hypothesis testing. It describes the process of determining whether the observed difference in sample proportions is significantly high or low, given the null hypothesis. The paragraph introduces the concept of rejecting or failing to reject the null hypothesis based on the test statistic's z-score and its relation to the significance level (alpha). It also discusses the conversion of the test statistic to a z-score and the use of p-values or critical values to make decisions about the null hypothesis.
📝 Applying P-Value and Critical Value Methods
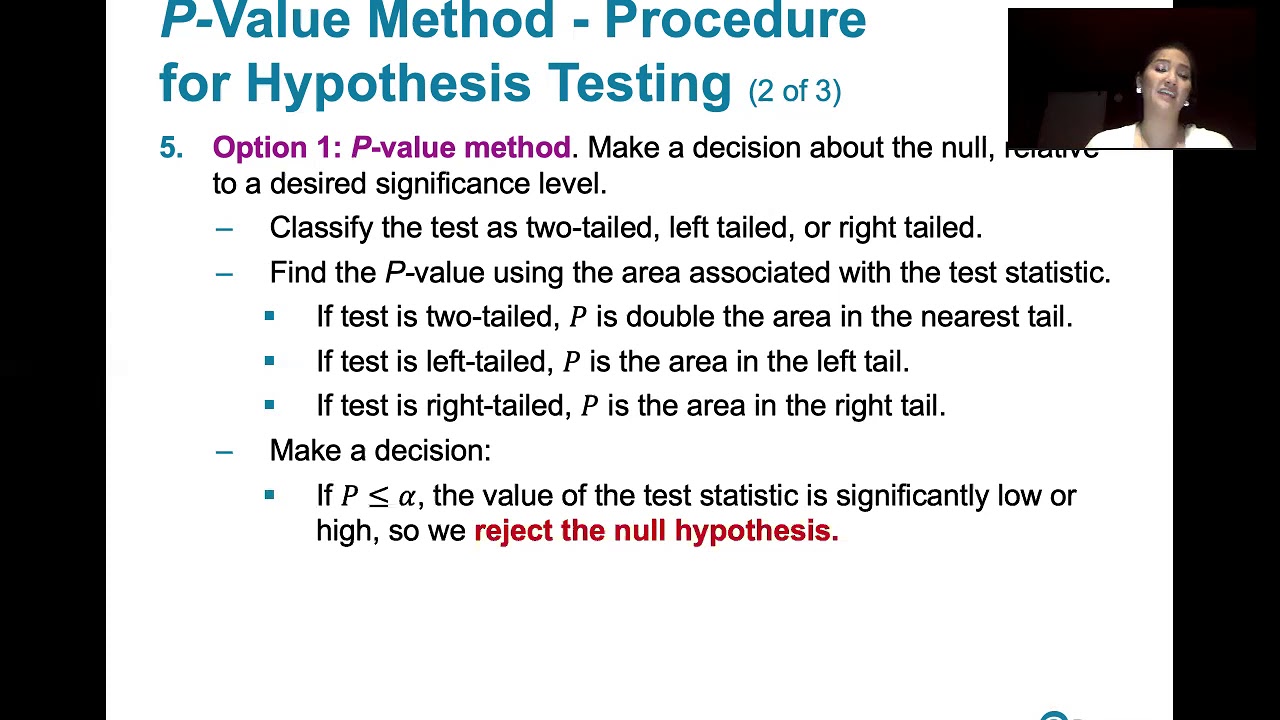
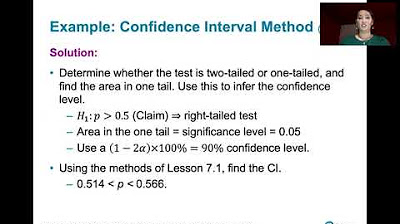
The sixth paragraph provides an overview of applying the p-value and critical value methods to test claims about two proportions. It explains the process of classifying the test as two-tailed, left-tailed, or right-tailed, and finding the p-value or critical values using technology or standard normal distribution tables. The paragraph emphasizes the importance of comparing the p-value to the significance level to decide whether to reject the null hypothesis and concludes with the need to state the findings in non-technical terms related to the original claim.
🎓 Summary of Hypothesis Testing Methods
The final paragraph summarizes the methods discussed in the video for hypothesis testing of two proportions. It reviews the process of using test statistics, p-values, and critical values, and the importance of understanding the underlying principles. The paragraph also looks forward to the next lesson, which will apply these methods to test claims about two proportions using the p-value method, and invites feedback on any misunderstandings or errors in the explanation.
Mindmap
Keywords
💡p-value method
💡critical value method
💡hypothesis testing
💡sample proportion
💡pooled sample proportion
💡sampling distribution
💡null hypothesis
💡alternative hypothesis
💡standard deviation
💡z-score
💡significance level (alpha)
Highlights
The video discusses the rationale behind the p-value method and critical value method for testing claims about two proportions.
It outlines the basic procedure for hypothesis testing involving two proportions without actually testing any hypotheses in the video.
The importance of hypothesis tests for comparing two groups in research is emphasized.
The video reviews the sampling distribution of the sample proportion (p-hat) and its properties.
The mean of the sampling distribution of p-hat is equal to the population proportion p, making it an unbiased estimator.
The standard deviation of the sampling distribution of p-hat is discussed, involving the formula involving p, q, and n.
The video explains the notation used for inferences about two proportions, including p1, n1, x1, and their counterparts for the second population.
The sampling distribution of the difference between sample proportions (p1-hat - p2-hat) and its mean and standard deviation are discussed.
The video clarifies the conditions under which a normal approximation to the binomial distribution is appropriate for hypothesis testing.
The requirements for testing claims about two proportions, including having two simple random samples and at least five successes and failures in each sample, are outlined.
The concept of the pooled sample proportion (p-bar) is introduced as an estimate of the common value of p1 and p2 under the null hypothesis.
The formula for calculating the pooled sample proportion and its role in hypothesis testing is explained.
The video demonstrates how to compute the test statistic z for the difference between sample proportions.
The process of conducting a hypothesis test using the critical value method or the p-value method is detailed.
The video explains how to graph the sampling distribution of p1-hat - p2-hat and determine the significance of the sample statistic.
The decision-making process in hypothesis testing, involving comparing the p-value to the significance level alpha, is clarified.
The video concludes with a review of the steps involved in testing claims about two proportions using p-values and critical values.
Practical advice on using technology for computations and understanding the underlying principles of hypothesis testing is provided.
Transcripts
Browse More Related Video
8.2.1 Testing a Claim About a Proportion - P-value, Critical Value Methods, Normal Approximation
8.2.2 Testing a Claim About A Proportion - Confidence Interval Method, Comparison to Other Methods
9.2.3 Two Means, Indep. Samples - Critical Value Method, St. Deviations Unknown, Not Assumed Equal
8.1.5 Basics of Hypothesis Testing - P-value Method, and Comparison to the Critical Value Method
9.2.2 Two Means, Independent Samples - The Rationale Behind The Equivalent Methods, P-value Method

Elementary Stats Lesson #18
5.0 / 5 (0 votes)
Thanks for rating: