Using StatCrunch to perform hypothesis testing on two proportions of referee calls
TLDRIn this informative video, Professor Curtis from Aspire Mountain Academy guides viewers through a statistical analysis using StatCrunch to test the hypothesis that men and women have equal success rates in challenging referee calls in tennis. The video covers setting up null and alternative hypotheses, identifying the test statistic, evaluating the P-value against a 1% significance level, and constructing a confidence interval. The conclusion drawn from the analysis suggests that there is not enough evidence to reject the claim of equal success rates between men and women, as the confidence interval includes zero, indicating the proportions could be the same. The video is an excellent resource for those interested in learning more about hypothesis testing and statistical analysis in an accessible and engaging manner.
Takeaways
- 📚 **Hypothesis Testing**: The video explains how to use StatCrunch for hypothesis testing on two proportions, specifically the success rates of men and women challenging referee calls in tennis.
- 🎯 **Null Hypothesis**: The null hypothesis (H0) states that there is no difference between the proportions of successful challenges by men and women, implying they have equal success rates.
- 🚫 **Alternative Hypothesis**: The alternative hypothesis (H1) suggests that the success rates of men and women in challenging calls are not equal.
- 📊 **Test Statistic**: The test statistic is identified using statistical software, in this case, StatCrunch, which simplifies the process of finding the necessary values for the hypothesis test.
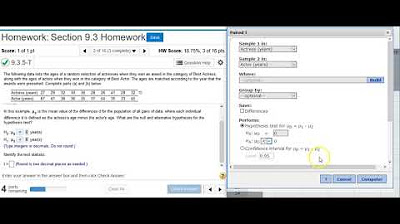
- 🔢 **Sample Input**: The video demonstrates entering summary statistics into StatCrunch, with men's data as Sample 1 and women's data as Sample 2, based on the order mentioned in the problem statement.
- 📉 **P-value Calculation**: The P-value, obtained from the results in StatCrunch, is used to evaluate whether there is enough evidence to reject the null hypothesis at a 1% significance level.
- 🔴 **P-value Evaluation**: A P-value greater than the significance level indicates failure to reject the null hypothesis, suggesting insufficient evidence to claim a difference in success rates.
- 📐 **Confidence Interval**: Constructing a confidence interval helps determine if there is a significant difference between the two proportions by checking if zero is within the interval limits.
- ✅ **Equal Proportions**: If zero is included in the confidence interval, it suggests that the two proportions could be the same, indicating no significant difference between men and women's success rates.
- 🤔 **Conclusion**: Based on the confidence interval including zero, there is not enough evidence to reject the claim that men and women have equal success in challenging calls.
- 📝 **Educational Resource**: The video is part of a series of statistics homework help provided by Professor Curtis of Aspire Mountain Academy, offering additional learning resources for those needing assistance in statistics.
Q & A
What is the main topic of the video?
-The video is about using StatCrunch to perform hypothesis testing on two proportions of referee calls in tennis, specifically comparing the success rates of men and women in challenging calls.
What is the claim being tested in the hypothesis?
-The claim being tested is that men and women have equal success in challenging referee calls in tennis tournaments.
What is the significance level used for the hypothesis test?
-The significance level used for the hypothesis test is 1%.
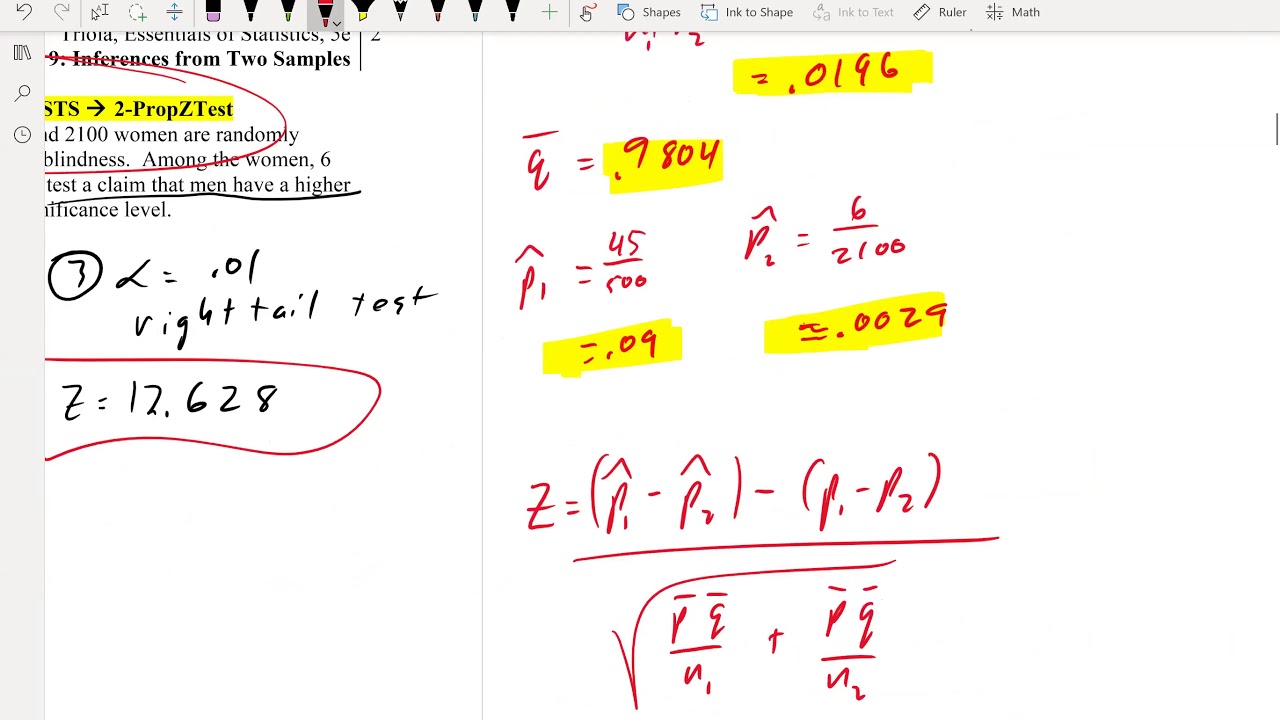
How many referee calls did men challenge and how many were overturned?
-Men challenged 1429 referee calls, and 417 of those calls were overturned.
How many referee calls did women challenge and how many were overturned?
-Women challenged 747 referee calls, and 230 of those calls were overturned.
What is the null hypothesis in this scenario?
-The null hypothesis is that there is no difference between the proportions of successful challenges made by men and women.
What is the alternative hypothesis in this scenario?
-The alternative hypothesis is that there is a difference between the proportions of successful challenges made by men and women.
What does it mean to fail to reject the null hypothesis?
-Failing to reject the null hypothesis means that there is not enough statistical evidence to conclude that there is a difference between the two proportions, and we cannot say that men and women do not have equal success in challenging calls.
What is the P-value obtained from the hypothesis test?
-The P-value obtained from the hypothesis test is 43.6%, which is greater than the significance level of 1%.
What does the confidence interval constructed in Part B indicate?
-The confidence interval constructed in Part B includes zero, indicating that there is no significant difference between the two proportions of successful challenges, and they could be the same.
What conclusion can be drawn from the confidence interval including zero?
-If zero is included in the confidence interval, it suggests that the proportions being compared could be equal, meaning there is no significant difference between men and women's success in challenging calls.
What does the final conclusion in Part C of the video suggest about the success of men and women in challenging calls?
-The final conclusion in Part C suggests that based on the results, it appears that men and women have equal success in challenging calls, as there is not sufficient evidence to reject the claim that they are the same.
Outlines
📚 Hypothesis Testing on Two Proportions
Professor Curtis introduces a statistics homework help segment focused on using StatCrunch for hypothesis testing. The problem involves comparing the success rates of men and women challenging referee calls in tennis post-instant replay system introduction. The professor explains the process of setting up null and alternative hypotheses, with the null hypothesis stating that the two proportions (success rates) are equal. The alternative hypothesis, therefore, is that they are not equal. The professor then demonstrates how to input the data into StatCrunch, perform the test, and interpret the results, including identifying the test statistic and P-value.
🔍 Evaluating the P-value and Constructing a Confidence Interval
The video continues with evaluating the obtained P-value against a 1% significance level. Since the P-value (43.6%) is greater than the significance level, the null hypothesis is not rejected, indicating insufficient evidence to claim that men and women have different success rates in challenging calls. The professor then guides through constructing a confidence interval for the difference between the two proportions using StatCrunch. The inclusion of zero within the confidence interval suggests that the two proportions could be the same, reinforcing the conclusion that there is no significant difference between men's and women's success rates. The video concludes with the professor summarizing the findings and encouraging students to provide feedback or visit Aspire Mountain Academy for more learning resources.
Mindmap
Keywords
💡Hypothesis Testing
💡StatCrunch
💡Null Hypothesis
💡Alternative Hypothesis
💡Significance Level
💡P-value
💡Confidence Interval
💡Sample Size
💡Proportion
💡Overturned Calls
💡Critical Region
Highlights
Professor Curtis introduces the topic of using StatCrunch for hypothesis testing on two proportions of referee calls.
The problem statement involves testing if men and women have equal success rates in challenging tennis referee calls post-instant replay system introduction.
The null hypothesis (H0) is defined as the claim that men and women have equal success in challenging calls, while the alternative hypothesis (H1) is that they do not.
StatCrunch software is used for statistical analysis, with a step-by-step guide provided for using it to perform the test.
The process involves entering summary statistics for both men and women's samples into StatCrunch.
The test statistic and P-value are identified using StatCrunch, with the P-value being greater than the 1% significance level.
The P-value of 43.6% is compared with the significance level, leading to a failure to reject the null hypothesis.
A confidence interval is constructed to further test the claim, with StatCrunch used to find the upper and lower limits.
The confidence interval includes zero, suggesting that there is no significant difference between the success rates of men and women in challenging calls.
The conclusion from the confidence interval supports the possibility that men and women have the same success rate in challenging calls.
The final answer to the question of whether men and women have equal success in challenging calls is that there is not enough evidence to suggest otherwise.
The video provides a comprehensive guide on hypothesis testing, from setting up hypotheses to interpreting results.
The use of statistical software simplifies the process of hypothesis testing for proportions, making it accessible to a wider audience.
The video emphasizes the importance of understanding the null and alternative hypotheses in the context of the problem statement.
The practical application of hypothesis testing in sports statistics is demonstrated through the tennis referee calls example.
The video concludes with an invitation for feedback and further learning resources at Aspire Mountain Academy.
The step-by-step approach to hypothesis testing using StatCrunch is designed to be educational and user-friendly.
The video serves as a valuable resource for students and educators looking to enhance their understanding of statistical analysis.
Transcripts
Browse More Related Video

Performing hypothesis testing on two proportions in StatCrunch
Using StatCrunch to perform hypothesis testing on two matched pair means of acting award ages

Finding a P-value given the test statistic

Using a z-score to complete hypothesis testing for a claim of equality
Math 119 Chapter 9 part 1

Finding the value of the test statistic for hypothesis testing on proportions
5.0 / 5 (0 votes)
Thanks for rating: