Performing hypothesis testing on two proportions in StatCrunch
TLDRIn this informative video, Professor Curtis from Aspire Mountain Academy guides viewers through a statistical analysis on the effectiveness of seatbelts in reducing car crash fatalities. Using a 5% significance level, the video demonstrates how to perform hypothesis testing on two proportions with StatCrunch. The problem involves comparing the fatality rates of 2763 occupants not wearing seatbelts, of which 31 were killed, to 7830 occupants wearing seatbelts, with 19 fatalities. The null hypothesis is set as equal proportions, while the alternative hypothesis, based on the claim, suggests that wearing seatbelts reduces fatalities. Through the hypothesis test, a test statistic and P-value are calculated, leading to the rejection of the null hypothesis in favor of the alternative. A confidence interval is also constructed, confirming that there is a significant difference between the two proportions, with the fatality rate being higher for those not wearing seatbelts. The video concludes with a strong statistical case for the effectiveness of seatbelts, encouraging viewers to engage with the content and seek further learning opportunities at Aspire Mountain Academy.
Takeaways
- 🧐 **Understanding Hypothesis Testing**: The video teaches how to use StatCrunch for hypothesis testing on two proportions, focusing on the effectiveness of seatbelts in reducing fatalities.
- 🔍 **Formulating Hypotheses**: The null hypothesis (H0) is a statement of equality, while the alternative hypothesis (H1) reflects the claim that seatbelts reduce fatalities, with p2 < p1.
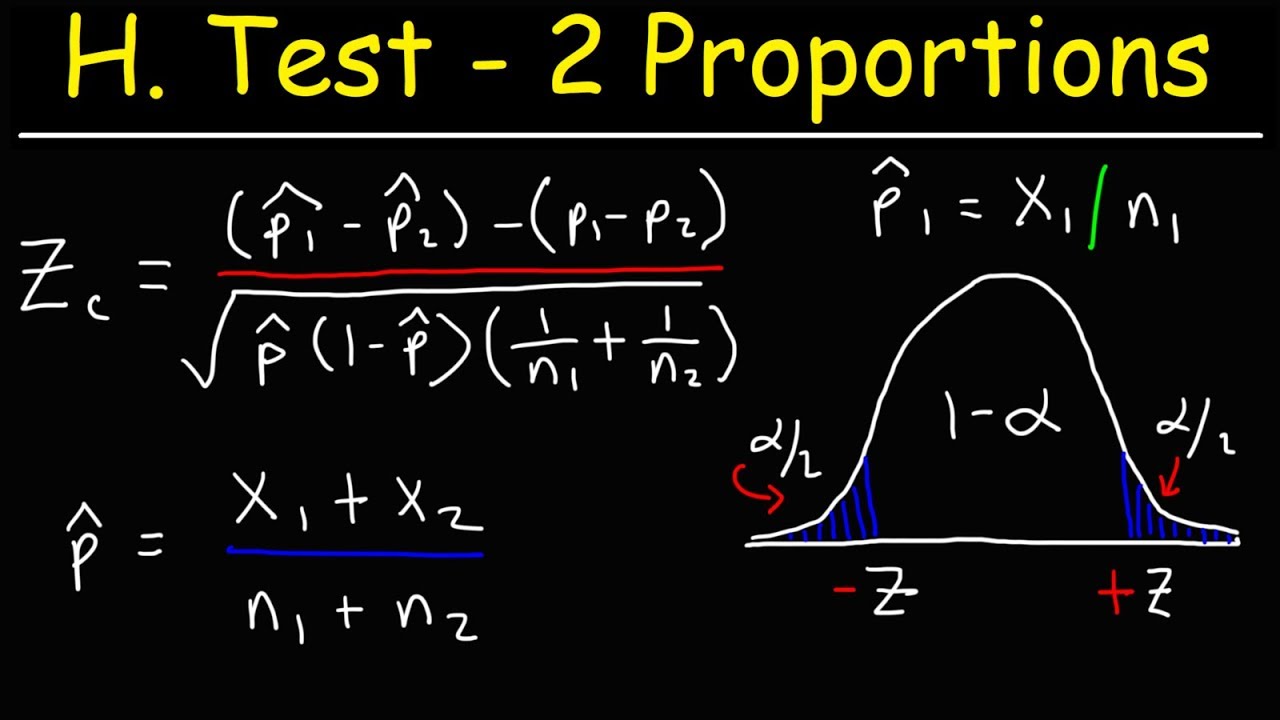
- 📊 **Identifying Test Statistic**: The test statistic is identified using StatCrunch, without needing to input data, by selecting the appropriate options based on the hypothesis test.
- 📉 **Calculating the P-value**: The P-value, found next to the test statistic in StatCrunch, is used to compare with the significance level to determine if the null hypothesis should be rejected.
- ❌ **Rejecting the Null Hypothesis**: If the P-value is less than the significance level (in this case, 5%), the null hypothesis is rejected, indicating there is a significant difference in fatality rates between seatbelt users and non-users.
- 📐 **Constructing a Confidence Interval**: For two-sample proportions, the appropriate confidence level is 1 - 2α, which in this case is 90%, to construct the confidence interval.
- 🔢 **Rounding Results**: Results from the test statistic and confidence interval should be rounded to the specified number of decimal places for accuracy.
- 🚫 **Zero in Confidence Interval**: If zero is not within the confidence interval, it suggests a significant difference between the two proportions, supporting the alternative hypothesis.
- ⬆️ **Positive Difference Significance**: A confidence interval that is entirely positive indicates that the proportion of deaths for non-seatbelt users (p1) is always greater than for seatbelt users (p2).
- 💡 **Implications for Seatbelt Effectiveness**: The results from both the hypothesis test and the confidence interval suggest that seatbelts are associated with a lower fatality rate.
- 📚 **Educational Resource**: The video is part of a series from Aspire Mountain Academy, offering statistics homework help and educational resources for students.
- 💬 **Engagement and Feedback**: Professor Curtis encourages viewers to leave comments for feedback and to visit their website for more learning resources or to provide suggestions for improvement.
Q & A
What is the main topic of the video?
-The video focuses on how to use StatCrunch to perform hypothesis testing on two proportions, specifically to test the claim that seatbelts are effective in reducing fatalities in car crashes.
What is the null hypothesis in the context of this video?
-The null hypothesis is a statement of equality, suggesting that there is no difference in the effectiveness of seatbelts in reducing fatalities, which is symbolized as p1 = p2, where p1 is the proportion of deaths among those not wearing seatbelts and p2 is the proportion among those wearing seatbelts.
How is the alternative hypothesis determined in this case?
-The alternative hypothesis is determined by the claim that seatbelts are effective in reducing fatalities. Since the claim implies that the proportion of deaths among seatbelt wearers (p2) is less than the proportion among non-wearers (p1), the alternative hypothesis is p2 < p1.
What statistical test is used in the video to analyze the data?
-The video uses a two-sample proportion test with summary statistics in StatCrunch to analyze the data regarding the effectiveness of seatbelts in reducing fatalities.
What is the significance level used in the hypothesis test?
-The significance level used in the hypothesis test is 5%, which is a common threshold for determining statistical significance.
How does the p-value from the hypothesis test influence the conclusion?
-The p-value, which is less than 0.0001 (practically zero), is lower than the significance level of 5%. This leads to the rejection of the null hypothesis, providing sufficient evidence to suggest that seatbelts are effective in reducing fatalities.
What is the purpose of constructing a confidence interval in Part B of the video?
-The purpose of constructing a confidence interval is to provide an estimated range within which the true difference between the two proportions (p1 and p2) is likely to lie, and to further support the conclusion about the effectiveness of seatbelts.
What confidence level is used for the confidence interval?
-The appropriate confidence level for the confidence interval, considering a two-sided test with a 5% significance level, is 90%.
What does it mean if the confidence interval does not include zero?
-If the confidence interval does not include zero, it indicates that there is a significant difference between the two proportions, suggesting that the fatality rate is higher for those not wearing seatbelts compared to those wearing seatbelts.
What conclusion can be drawn from the results of both the hypothesis test and the confidence interval?
-Both the hypothesis test and the confidence interval lead to the conclusion that there is a statistically significant difference in fatality rates between those wearing seatbelts and those not wearing them, suggesting that the use of seatbelts is associated with a lower fatality rate.
What is the main suggestion from the results of the statistical analysis in the video?
-The main suggestion from the results is that seatbelts are effective in reducing the fatality rate in car crashes, implying that their use is associated with fewer fatalities.
How can viewers get more help with statistics if they find their teacher unhelpful?
-Viewers can visit aspiremountainacademy.com to access lecture videos and other resources for learning statistics, or to provide feedback on what they would like to see covered.
Outlines
🧐 Hypothesis Testing on Two Proportions with StatCrunch
Professor Curtis introduces the topic of hypothesis testing on two proportions using StatCrunch. The video begins with a problem statement involving a comparison of fatality rates between car crash occupants wearing seatbelts and those not wearing seatbelts. The professor explains the process of forming null and alternative hypotheses based on the claim that seatbelts reduce fatalities. He then demonstrates how to input the summary statistics into StatCrunch and perform the hypothesis test, including setting up the correct inequality for the test. The video emphasizes the importance of understanding the problem statement and the hypotheses before proceeding with the test.
📊 Analyzing Test Results and Constructing Confidence Intervals
After performing the hypothesis test, Professor Curtis explains how to interpret the results, focusing on the test statistic and the P-value. He shows that with a P-value much less than the significance level, the null hypothesis is rejected, indicating there is sufficient evidence to support the claim that seatbelts are effective in reducing fatalities. The professor then moves on to constructing a confidence interval for the difference between the two proportions. He discusses how to determine the appropriate confidence level, which in this case is 90%, and inputs the necessary values into StatCrunch to obtain the interval. The confidence interval does not include zero, confirming a significant difference between the two proportions and further supporting the effectiveness of seatbelts in reducing fatalities.
📚 Conclusion and Next Steps at Aspire Mountain Academy
Professor Curtis concludes the video by summarizing the findings from both the hypothesis test and the confidence interval, which both suggest that seatbelts are associated with a lower fatality rate. He encourages viewers to consider the statistical evidence when assessing the effectiveness of seatbelts. The video ends with a call to action for viewers to leave comments and provide feedback on the video, as well as to visit Aspire Mountain Academy's website for more educational resources and to learn about their statistics courses. Professor Curtis thanks the viewers for watching and looks forward to their participation in future videos.
Mindmap
Keywords
💡Hypothesis Testing
💡StatCrunch
💡Null Hypothesis
💡Alternative Hypothesis
💡Significance Level
💡Test Statistic
💡P-value
💡Confidence Interval
💡Sample Proportions
💡Effectiveness of Seatbelts
💡Two Sample Proportion Test
Highlights
Professor Curtis provides statistics homework help on using StatCrunch for hypothesis testing on two proportions.
The problem involves testing the claim that seatbelts reduce fatalities in car crashes using a 5% significance level.
Null hypothesis is a statement of equality, while the alternative hypothesis reflects the claim that seatbelts are effective.
The group not wearing seatbelts is considered the first sample, and the group wearing seatbelts is the second sample.
The alternative hypothesis is that the proportion of deaths for seatbelt wearers (p2) is less than the proportion for non-wearers (p1).
StatCrunch is used to identify the test statistic and P-value for the hypothesis test.
The test statistic is found by performing a two-sample proportion test with summary statistics in StatCrunch.
The P-value is less than 0.0001, indicating strong evidence against the null hypothesis.
The null hypothesis is rejected due to the P-value being lower than the significance level.
Sufficient evidence supports the claim that seatbelts are effective in reducing fatalities.
A confidence interval is constructed to further assess the effectiveness of seatbelts.
The appropriate confidence level for the interval is 90%, derived from the given significance level.
The confidence interval does not include zero, indicating a significant difference between the two proportions.
The conclusion from the confidence interval is that the fatality rate is higher for those not wearing seatbelts.
Both the hypothesis test and the confidence interval suggest that seatbelt use is associated with a lower fatality rate.
The results imply that wearing seatbelts leads to a lower number of fatalities in car crashes.
Aspire Mountain Academy offers resources for learning statistics and feedback on their educational content.
Transcripts
Browse More Related Video

Using StatCrunch to perform hypothesis testing on two matched pair means of acting award ages

Using StatCrunch to perform hypothesis testing on two proportions of referee calls

Finding the value of the test statistic for hypothesis testing on proportions

Finding a P-value given the test statistic

Using a z-score to complete hypothesis testing for a claim of equality
Hypothesis Testing With Two Proportions
5.0 / 5 (0 votes)
Thanks for rating: