Using a z-score to complete hypothesis testing for a claim of equality
TLDRIn this informative video, Professor Curtis from Aspire Mountain Academy offers a comprehensive guide on hypothesis testing using a z-score. The video begins by identifying the type of hypothesis test based on the claim that the population proportion exceeds 30%, which is determined to be a right-tailed test due to the greater-than sign. Next, the professor demonstrates how to find the P-value using StatCrunch's Normal calculator, yielding a P-value of 0.007. Finally, the video concludes with a decision-making process where the P-value is compared to the significance level (alpha = 5%). Since the P-value is less than the alpha level, the null hypothesis (Ho) is rejected, indicating there is sufficient evidence to support the claim that the population proportion is indeed greater than 30%. The video encourages viewers to engage by leaving comments and visiting the academy's website for further assistance in statistics.
Takeaways
- 📚 The video is a statistics homework help session by Professor Curtis from Aspire Mountain Academy focusing on using a z-score for hypothesis testing.
- 🔍 The problem involves a z-score of 2.45 to test the claim that the population proportion is greater than 30%.
- ➡️ Part A identifies the hypothesis test as right-tailed based on the claim's greater-than sign, which points to the right.
- 🧮 Part B involves finding the P-value using a Normal calculator in StatCrunch, which is shown to be 0.007 or seven tenths of 1%.
- ✅ For Part C, the decision to reject or not reject the null hypothesis (Ho) is made by comparing the P-value to the significance level (alpha), which is 5% in this case.
- 🚫 Since the P-value (0.007) is less than the alpha level (0.05), the correct conclusion is to reject Ho, indicating sufficient evidence to support the claim.
- 📉 The video demonstrates the process of hypothesis testing step by step, from identifying the type of test to calculating the P-value and making a conclusion.
- 📈 The use of a Normal calculator is crucial for finding the P-value when only the z-score is known.
- 📘 The standard normal distribution is used in the calculator with default values, which is appropriate for this type of problem.
- 🔑 The inequality sign in the calculator should match the direction of the tail for the test, which is greater-than-or-equal-to for a right-tailed test.
- 💡 Rejection of Ho implies there is enough evidence to support the claim, while failing to reject Ho means there is insufficient evidence.
- 🌟 The video encourages viewers to provide feedback and comments to improve the content and offers additional resources at aspiremountainacademy.com.
Q & A
What is the main topic of Professor Curtis's video?
-The main topic of the video is how to use a z-score to complete hypothesis testing for a claim of equality in statistics.
What is the problem statement given in the video?
-The problem statement is that a test statistic of z = 2.45 is obtained when testing the claim that the population proportion is greater than 30%.
Which part of the video deals with identifying the type of hypothesis test?
-Part A of the video deals with identifying the hypothesis test as being two-tailed, left-tailed, or right-tailed.
How does the claim 'the population proportion is greater than 30%' determine the type of tail for the hypothesis test?
-The claim indicates a right-tailed test because the greater-than sign points to the right, suggesting that the test is looking for evidence in the right tail of the distribution.
What tool does Professor Curtis use to find the P-value in Part B?
-Professor Curtis uses the StatCrunch Normal calculator to find the P-value.
How does the P-value obtained from the Normal calculator relate to the hypothesis test?
-The P-value represents the probability of observing a test statistic as extreme as, or more extreme than, the one calculated from the sample data, under the assumption that the null hypothesis is true.
What is the significance level (alpha) used in Part C of the video?
-The significance level (alpha) used is 5%.
How does the P-value compare to the alpha level in the video?
-The P-value, which is seven tenths of 1%, is less than the alpha level of 5%.
What conclusion is drawn in Part C based on the comparison of the P-value and the alpha level?
-Since the P-value is less than the alpha level, the conclusion is to reject the null hypothesis (Ho), indicating there is sufficient evidence to support the claim that the population proportion is greater than 30%.
What is the implication of rejecting the null hypothesis in the context of the video?
-Rejecting the null hypothesis means that there is enough statistical evidence to support the claim that the population proportion is indeed greater than 30%.
What does Professor Curtis encourage the viewers to do if they find their stats teacher unhelpful?
-Professor Curtis encourages viewers to visit aspiremountainacademy.com for lecture videos and additional help in learning statistics.
How can viewers provide feedback or ask for improvements on the content provided by Aspire Mountain Academy?
-Viewers can provide feedback or ask for improvements by leaving comments below the video or by visiting aspiremountainacademy.com and providing their input there.
Outlines
📚 Introduction to Z-Score Hypothesis Testing
Professor Curtis begins the video by introducing the topic of z-scores in the context of hypothesis testing for claims of equality. The video is structured to address three parts: identifying the type of hypothesis test, calculating the P-value, and making a decision based on a significance level. The problem statement involves a z-score of 2.45 for a claim that the population proportion exceeds 30%.
🧐 Identifying the Hypothesis Test Type
The first part of the video focuses on identifying whether the hypothesis test is two-tailed, left-tailed, or right-tailed. The claim that the population proportion is greater than 30% indicates a right-tailed test, as the greater-than sign points to the right. This is confirmed by the professor in the answer field.
📊 Calculating the P-value Using StatCrunch
In the second part, the professor demonstrates how to find the P-value using the StatCrunch software. The process involves using the Normal calculator with the given z-score to reflect the alternative hypothesis. The professor inputs the z-score into the calculator and computes the P-value, which is found to be 0.007, indicating the probability of observing a test statistic as extreme as 2.45 under the null hypothesis.
✅ Decision Making with Alpha Level and P-value
The final part of the video involves making a decision to either reject or fail to reject the null hypothesis (Ho) based on the P-value and a given significance level (alpha) of 5%. Since the P-value of 0.007 is less than the alpha level, the conclusion is to reject Ho, indicating there is sufficient evidence to support the claim that the population proportion is greater than 30%. The professor emphasizes the consistency between rejecting Ho and having sufficient evidence to support the claim.
📝 Conclusion and Feedback Invitation
The video concludes with a reminder of the process and an invitation for viewers to provide feedback or comments on the video's effectiveness. The professor also encourages students to visit Aspire Mountain Academy's website for more learning resources if they find their statistics teacher unhelpful or unengaging.
Mindmap
Keywords
💡z-score
💡hypothesis testing
💡population proportion
💡two-tailed, left-tailed, right-tailed test
💡P-value
💡significance level (alpha)
💡reject Ho (null hypothesis)
💡fail to reject Ho
💡StatCrunch
💡Normal calculator
💡standard normal distribution
Highlights
Learn how to use a z-score to complete hypothesis testing for a claim of equality.
Problem statement: Test statistic z = 2.45 obtained when testing claim that population proportion is greater than 30%.
Part A: Identify the hypothesis test as two-tailed, left-tailed, or right-tailed by examining the claim.
Claim that population proportion is greater than 30% indicates a right-tailed test.
Part B: Find the P-value using StatCrunch and the Normal calculator with the given z-score.
Ensure the inequality sign in the Normal calculator matches the right-tailed test.
The P-value, the area under the curve, is 0.007.
Part C: Compare the P-value to the significance level alpha to determine the conclusion.
Given alpha level is 5% and P-value is 0.7%, P-value is less than alpha.
Reject the null hypothesis Ho since P-value is less than alpha, indicating sufficient evidence to support the claim.
Rejecting Ho means there is sufficient evidence for the claim. Failing to reject Ho means insufficient evidence.
If the P-value was greater than alpha, we would fail to reject Ho.
The video provides a step-by-step guide to hypothesis testing using a z-score.
The video uses a real-world example to illustrate the process.
The video explains how to interpret the results and make a conclusion.
The video uses clear visuals and examples to make the concepts easy to understand.
The video provides helpful tips and guidance for completing statistics homework.
The video is part of a series of statistics help videos from Aspire Mountain Academy.
Aspire Mountain Academy offers lecture videos and other resources to help students learn statistics.
The video encourages viewers to provide feedback and suggestions for improvement.
Transcripts
Browse More Related Video
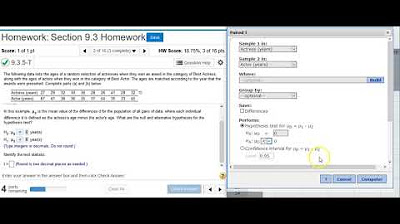
Using StatCrunch to perform hypothesis testing on two matched pair means of acting award ages
Hypothesis testing: step-by-step, p-value, t-test for difference of two means - Statistics Help

Finding a P-value given the test statistic

Performing hypothesis testing on two proportions in StatCrunch

Using StatCrunch to perform hypothesis testing on two proportions of referee calls

What is p-value? How we decide on our confidence level.
5.0 / 5 (0 votes)
Thanks for rating: