Math 119 Chapter 9 part 1
TLDRThis video script covers Chapter Nine, focusing on hypothesis testing for two proportions, using both pooled and unpooled samples. It discusses when to use each approach and emphasizes the importance of knowing or assuming equal standard deviations. The script guides through a step-by-step process of hypothesis testing, including setting up null and alternative hypotheses, calculating test statistics, and interpreting p-values to make statistical decisions. Examples include testing color blindness rates in men and women, the effectiveness of the Salk vaccine, and comparing success rates of different treatments for carpal tunnel syndrome. The video also explains how to use calculator functions to simplify calculations and stresses the importance of understanding the underlying statistical concepts.
Takeaways
- 📚 The lesson covers chapter nine, focusing on hypothesis tests for two proportions, using both pooled and unpooled data depending on the situation.
- 🔍 The choice between pooled and unpooled data is based on whether the standard deviations of the populations are known to be equal or not.
- 🧐 The instructor emphasizes the importance of understanding when to use pooled versus unpooled data, but will not deeply delve into the complexities within this class.
- 📉 The class will primarily use a calculator for computations to avoid time-consuming and error-prone manual calculations.
- 🔢 A formula is introduced for calculating the test statistic, but the instructor reassures students that they will mostly rely on the calculator for such tasks.
- 📈 An example is given involving red-green color blindness in men and women, testing the claim that men have a higher rate of colorblindness using a significance level of 0.01.
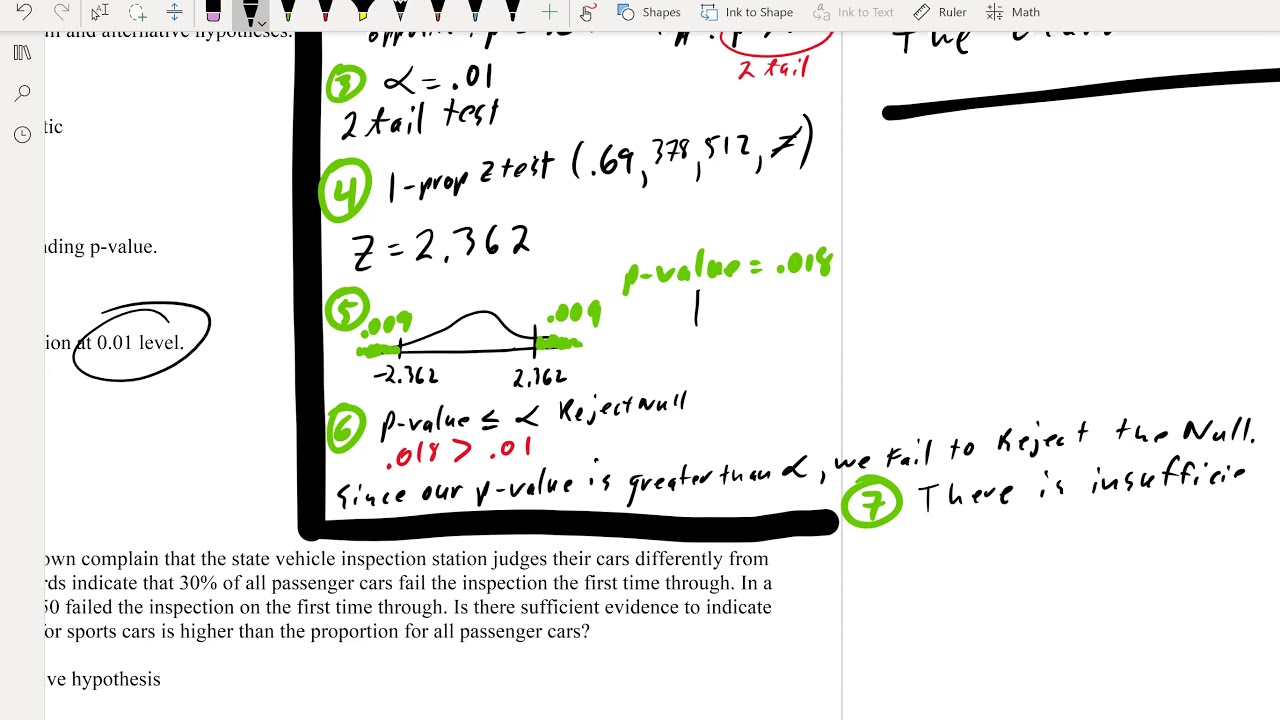
- 📝 The process of setting up a hypothesis test is explained step-by-step, including formulating the null and alternative hypotheses, selecting the significance level, and calculating the test statistic.
- 🧐 The concept of p-values is introduced, explaining that a very small p-value (close to zero) indicates strong evidence against the null hypothesis.
- 🛂 The Salk vaccine example is used to demonstrate testing the effectiveness of a vaccine in lowering the polio rate, using a significance level of 0.05.
- 📊 The script discusses confidence intervals for two proportions, explaining that if zero is not within the interval, there is a significant difference between the two proportions.
- 🧳 A luggage loss example is used to illustrate the application of confidence intervals, showing how to determine if there is a significant difference in lost luggage proportions between two airlines.
Q & A
What is the main topic of Chapter Nine in the transcript?
-The main topic of Chapter Nine is hypothesis tests on two proportions using both pooled and unpooled data samples.
When should one use unpooled data samples in hypothesis testing?
-One should use unpooled data samples when the standard deviation of the populations is unknown or when it's not certain if they are equal.
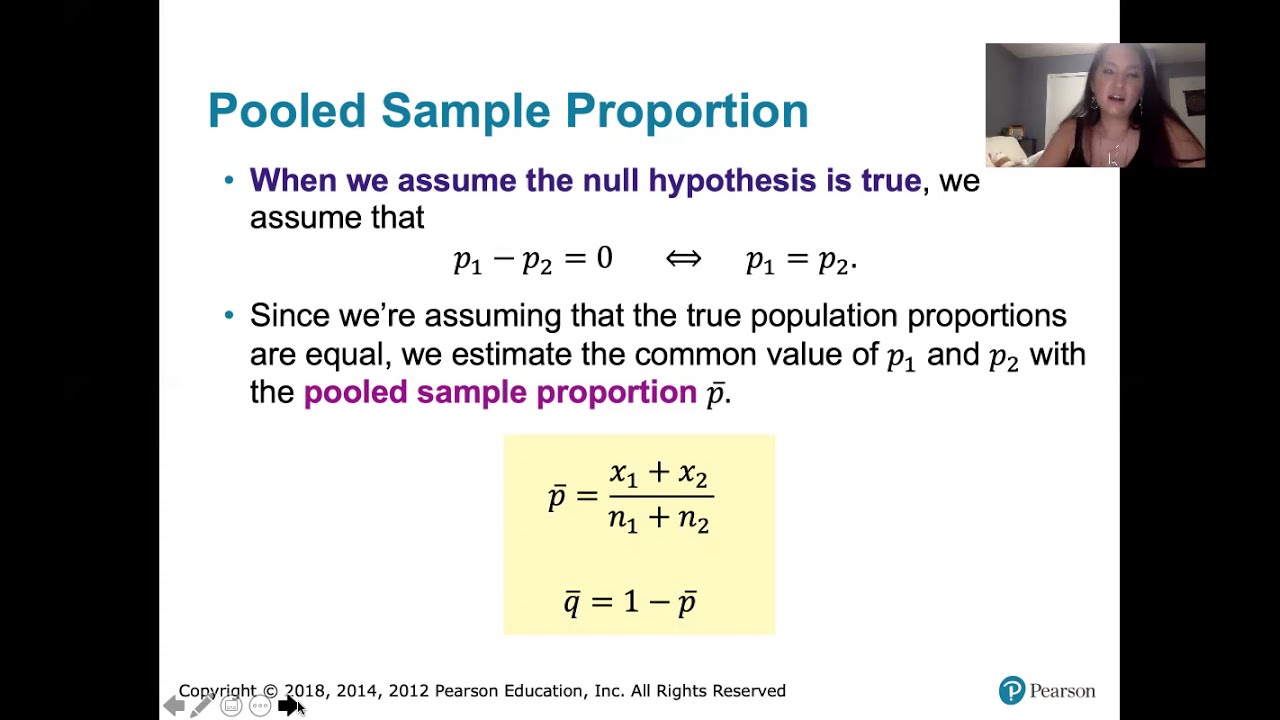
What is the significance of using a pooled approach in hypothesis testing?
-A pooled approach is used when it is known that the standard deviations of the populations are the same, simplifying the calculation of the test statistic.
What is the purpose of the formula given in the transcript for finding the test statistic?
-The formula is used to calculate the test statistic for hypothesis tests on two proportions, which is then used to determine whether to reject or accept the null hypothesis.
Why does the instructor suggest using a calculator for finding the test statistic?
-The instructor suggests using a calculator to avoid time-consuming manual calculations and reduce the chance of making errors, especially when dealing with complex formulas.
What is the null hypothesis in the context of the red-green color blindness study mentioned in the transcript?
-The null hypothesis is that the proportion of men with red-green color blindness (p1) is equal to the proportion of women with red-green color blindness (p2).
What is the significance level used in the red-green color blindness study?
-The significance level used in the study is 0.01, indicating a very low probability of a Type I error.
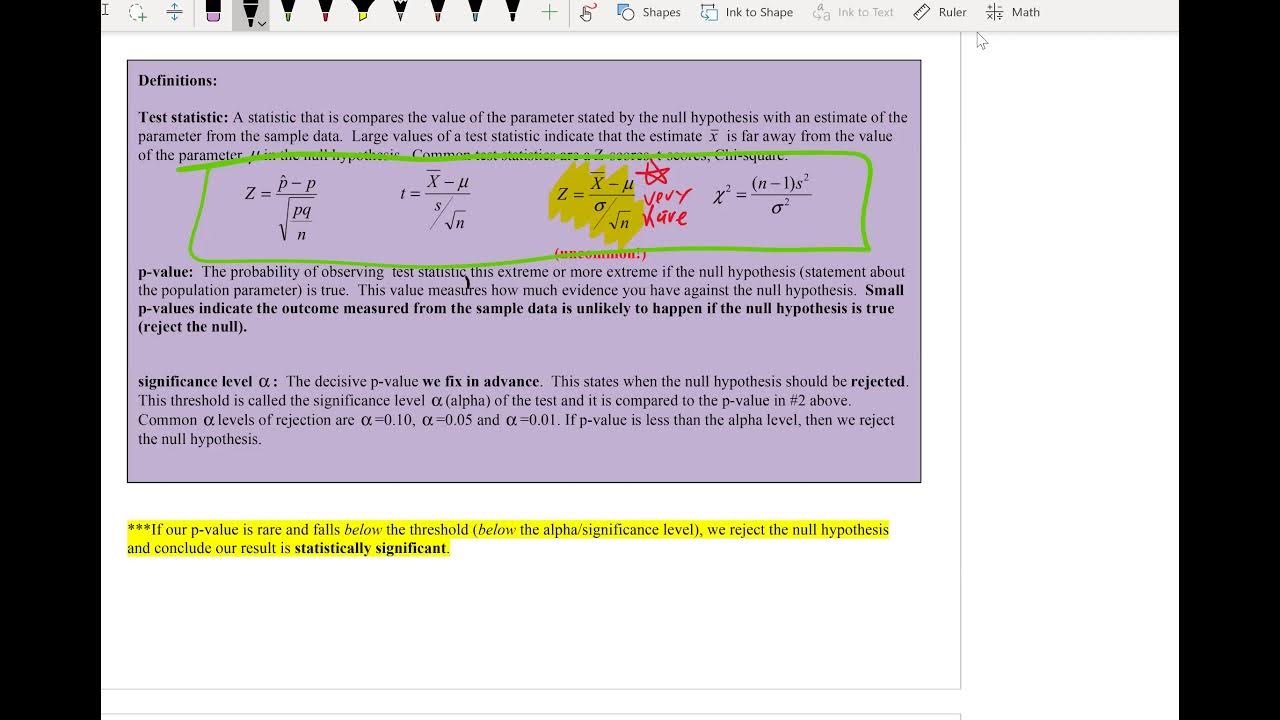
What does the p-value represent in hypothesis testing?
-The p-value represents the probability of observing the test statistic under the assumption that the null hypothesis is true. A very small p-value suggests strong evidence against the null hypothesis.
What is the conclusion of the red-green color blindness study based on the transcript?
-The conclusion is that there is sufficient evidence to support the claim that men have a higher rate of red-green color blindness than women.
How does the instructor approach teaching the concept of confidence intervals for two proportions?
-The instructor explains that confidence intervals for two proportions are used to estimate the difference between two population proportions (p1 - p2), and if zero is not within the interval, it suggests a significant difference between the two proportions.
What is the practical application of the concepts taught in Chapter Nine as illustrated in the transcript?
-The practical application includes analyzing data from studies, such as the effectiveness of the Salk vaccine or the success rates of different treatments, to make statistical inferences and support claims with evidence.
Outlines
📚 Introduction to Chapter Nine: Hypothesis Testing for Two Proportions
The instructor begins Chapter Nine by introducing the concept of hypothesis testing for two proportions, explaining the use of pooled and unpooled data depending on the known variance of population standard deviations. They emphasize that the choice between pooled and unpooled methods can be complex and situational, but for the class, they will focus on hypothesis tests for two proportions using sample data. The instructor also introduces a formula for calculating the test statistic but reassures students that a calculator will be used to simplify the process, reducing the need for manual calculation. An example involving red-green color blindness in men and women is presented to illustrate the application of these concepts, with a significance level of 0.01 used to test the claim that men have a higher rate of colorblindness.
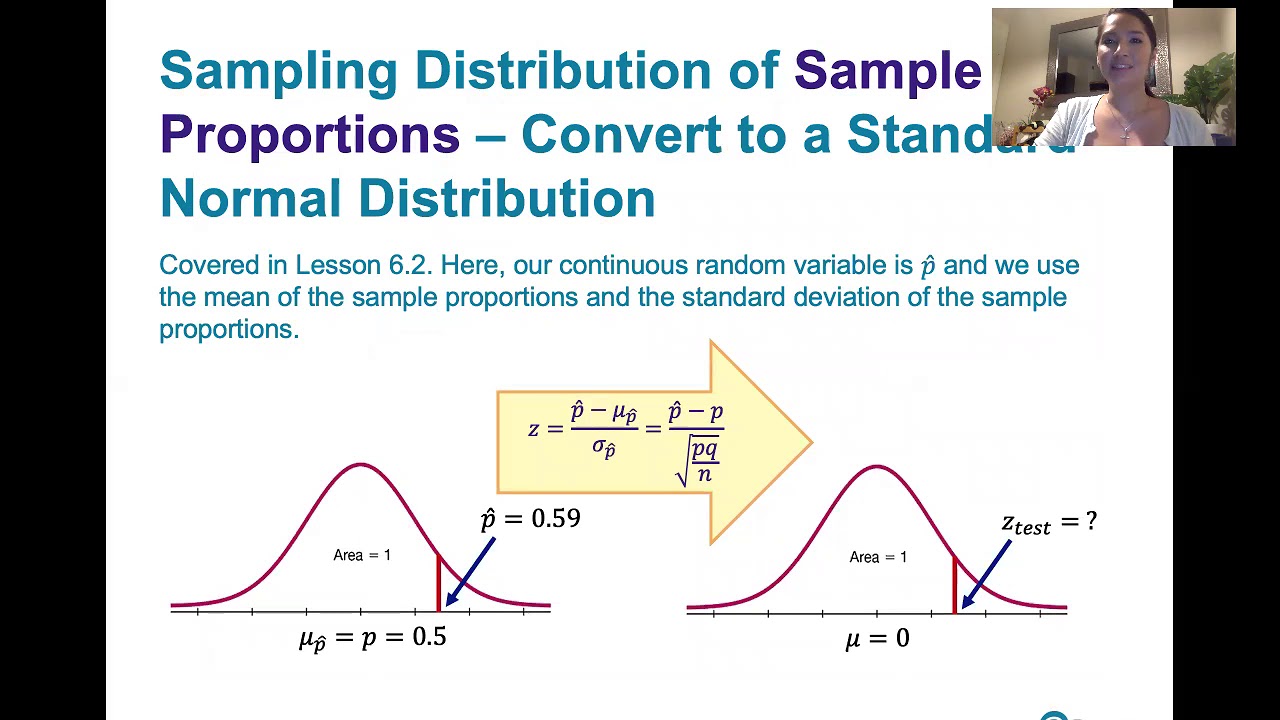
🔍 Calculating the Test Statistic and Determining the P-Value
The instructor demonstrates the process of calculating the test statistic for a two-proportion z-test using the example of color blindness prevalence in men and women. They explain the formula for calculating the pooled proportion (p-bar) and how to find p-hat and q-hat for each population. The instructor then simplifies the process by using a calculator to perform the test, obtaining a z-score of 12.628. They discuss the significance of a very small p-value, indicating strong evidence against the null hypothesis, which in this case suggests that men have a significantly higher rate of red-green color blindness than women.
🛡️ Statistical Decision Making in Hypothesis Testing
The instructor guides students through the steps of statistical decision making, starting with the establishment of the null and alternative hypotheses. They use the example of the Salk vaccine's effectiveness in reducing polio rates, with a significance level of 0.05. The instructor explains how to compute the test statistic using a calculator and interpret the resulting z-score and p-value. A z-score of -6.7416 indicates strong evidence in favor of the vaccine's effectiveness, as the p-value is extremely small, leading to the rejection of the null hypothesis and acceptance of the alternative hypothesis that the vaccine is effective.
📉 Confidence Intervals for Two Proportions
The instructor introduces the concept of confidence intervals for estimating the difference between two population proportions. They explain the formula for calculating the confidence interval and emphasize the importance of whether zero is included in the interval. If zero is not included, it suggests a significant difference between the proportions. The instructor uses a calculator to demonstrate how to calculate the confidence interval for the success rates of surgery versus splint treatment for carpal tunnel syndrome, highlighting the process and its implications for determining significant differences.
🧳 Comparing Lost Luggage Rates with Confidence Intervals
The instructor concludes the chapter with an example of using confidence intervals to compare the lost luggage rates of American Airlines and Delta. They calculate the confidence interval for the difference in proportions and explain that if zero is within the interval, there is no significant difference between the two proportions. In this case, the interval includes zero, suggesting that there may not be a significant difference in the lost luggage rates between the two airlines, based on the sample data provided.
Mindmap
Keywords
💡Pooled vs. Unpooled
💡Standard Deviation
💡Hypothesis Test
💡Test Statistic
💡p-value
💡Significance Level
💡Null Hypothesis
💡Alternate Hypothesis
💡Confidence Interval
💡Type I and Type II Errors
Highlights
Introduction to Chapter Nine focusing on hypothesis tests for two proportions using pooled and unpooled data.
Discussion on when to use pooled versus unpooled data based on the known standard deviation and equality.
Explanation of the formula for calculating the test statistic for two proportions.
Humor and clarification that the formula will be demonstrated but primarily calculators will be used for simplicity.
A study on red-green color blindness used to illustrate the hypothesis testing process with a significance level of 0.01.
Null and alternate hypotheses setup for the color blindness study, focusing on the claim that men have a higher rate of colorblindness.
Demonstration of calculating p-bar and q-bar for the color blindness study to find the test statistic.
Use of a calculator for two prop z test to find the z-score for the color blindness study.
Interpretation of a very small p-value indicating strong evidence against the null hypothesis in the color blindness study.
Application of hypothesis testing to the initial test of the Salk vaccine for polio with a significance level of 0.05.
Setting up the null and alternate hypotheses for the Salk vaccine study, focusing on the vaccine's effectiveness.
Calculation of the test statistic using a calculator for the Salk vaccine study and its interpretation.
Explanation of confidence intervals for two proportions and their use in determining differences between population proportions.
Demonstration of how to calculate a confidence interval for two proportions using a calculator.
Interpretation of a confidence interval result in a carpal tunnel syndrome treatment study, indicating a difference between treatments.
Final example of a luggage loss study comparing American Airlines and Delta, using a 99% confidence interval to find no significant difference.
Emphasis on the importance of using confidence intervals to back up sample percentage observations with mathematical certainty.
Transcripts
Browse More Related Video
Math 119 Chap 8 part 2
Math 119 Chap 8 part 1
8.1.3 Basics of Hypothesis Testing - Computing and Interpreting Test Statistics

Using StatCrunch to perform hypothesis testing on two proportions of referee calls
9.1.1 Two Proportions - Rationale Behind Hypothesis Tests Involving Two Proportions

Session 45 - Hypothesis Testing Part 1 | DSMP 2023
5.0 / 5 (0 votes)
Thanks for rating: