Math 11 - Sections 1.1-1.2
TLDRThe video script is an in-depth exploration of limits in calculus, focusing on numerical and graphical approaches. It begins by defining limits and illustrating the concept through a function's behavior as the input approaches a certain value. The script uses the example of f(x) = 2x + 1 to demonstrate how to find the limit as x approaches a specific number, emphasizing the importance of the limit being a unique real number. It explains the process of finding two-sided limits and how they can exist even if the function's value at that point is undefined. The script also covers the concept of continuity, explaining that a function is continuous at a point if the limit exists and equals the function's value at that point. It provides various examples using graphs to determine continuity and discontinuity. The lesson concludes with practice problems for students to apply the concepts learned.
Takeaways
- 📘 The concept of a limit in calculus is defined as the value that the function f(x) approaches as x approaches a certain value 'a'.
- 📈 When graphing limits, if the function's value at a point 'a' exists and is unique, the limit at that point is the same as the function's value.
- 🔍 To find a limit, one can use a numerical approach by plugging in values close to 'a' to see if they approach a consistent value L.
- 📊 Graphically, limits can be determined by observing the behavior of the function's graph as it approaches the point in question from both directions.
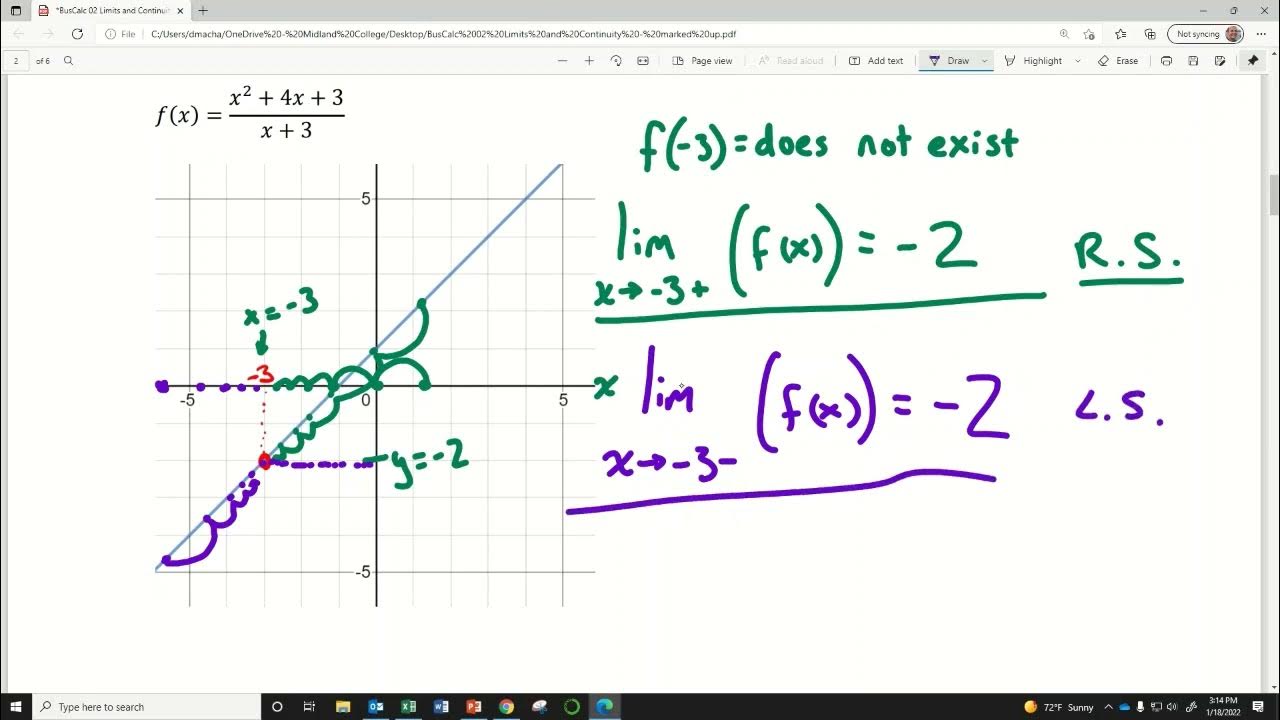
- 🚫 A function may have a limit at a point even if the function's value at that point is undefined or the point is not included in the domain of the function.
- ➡️ The left-hand limit and right-hand limit are checked to determine if they are equal to each other and to the function's value at 'a', if it exists.
- 🔢 For rational functions, if the numerator and denominator both approach zero, the limit can still exist and is found by factoring and simplifying.
- ∞ When finding limits as x approaches infinity, the highest power of x in the numerator and denominator determines the behavior of the limit.
- 🔄 If the highest powers of x in a rational function are the same, the limit as x approaches infinity is a constant. If the denominator's power is higher, the limit is zero. If the numerator's power is higher, the limit is infinity.
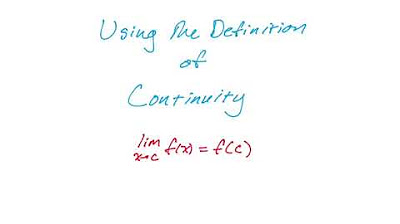
- 🔁 A function is continuous at a point if the limit exists, the function value exists, and both are equal. The graph of a continuous function can be drawn without lifting the pen.
- ⛔ Discontinuities occur when a jump or hole is present in the graph, or when the left-hand and right-hand limits differ or do not exist.
Q & A
What is the definition of a limit in calculus?
-The limit of a function f(x) as x approaches a is written as 'lim (x -> a) f(x) = L', which means that as the values of x approach 'a', the corresponding values of f(x) approach the limiting value L. The value L must be a unique real number.
How does the concept of a limit relate to the graph of a function?
-The concept of a limit can be visualized graphically by observing what happens to the y-values (values of the function) as x approaches a certain value 'a' from both the left and the right sides. If the y-values approach the same limiting value L from both sides, then the limit exists and is equal to L.
What is a unique real number in the context of limits?
-A unique real number in the context of limits is a specific value that the function's output approaches as the input (x-value) approaches a certain point 'a'. This value must be the same regardless of the direction from which 'a' is approached (from the left or the right).
What is the numerical approach to finding the limit of a function?
-The numerical approach to finding the limit of a function involves substituting values of x that are very close to the point of interest into the function and observing the corresponding y-values. By doing this, one can determine the value that the function's output approaches as x gets closer to the point 'a'.
How can you determine if a function is continuous at a certain point?
-A function is continuous at a certain point if the function's value exists at that point, the limit exists at that point, and both the function's value and the limit are equal to each other. Graphically, this means there is no hole or jump at that point on the graph of the function.
What is the difference between a left-hand limit and a right-hand limit?
-A left-hand limit is the value that the function's output approaches as the input (x-value) approaches a certain point 'a' from the left side. A right-hand limit is the value approached from the right side. If both the left-hand and right-hand limits exist and are equal, then the overall limit at that point exists.
What does it mean if the limit of a function as x approaches a certain value is undefined?
-If the limit of a function as x approaches a certain value is undefined, it means that the function's output does not approach a unique real number as the input gets closer to that value. This could be due to the function's graph having a hole, a jump discontinuity, or the function being undefined at that point.
What is a piecewise-defined function?
-A piecewise-defined function is a function that is defined by multiple sub-functions, each applicable in a certain interval or region of its domain. The function changes its formula or rule depending on the value of x that is being considered.
How do you find the limit of a constant function as x approaches a certain value?
-The limit of a constant function as x approaches any value is simply the constant itself. Since the function's output does not change with different x-values, the limit is the constant value of the function regardless of how x approaches it.
What is the definition of a function being continuous?
-A function is said to be continuous if at every point in its domain, the limit of the function as x approaches that point equals the function's value at that point. Additionally, the function must be defined at that point and have a derivative at that point (except possibly at jump discontinuities).
What is the relationship between the limit of a function and the function's graph?
-The limit of a function can often be understood by looking at the graph of the function. If the graph approaches a certain y-value as x approaches a certain x-value, then the limit at that point is the y-value it approaches. If the graph has a hole or an asymptote at a point, the limit may exist but the function value at that point is undefined.
Outlines
📚 Introduction to Limits in Calculus
The video begins with an introduction to limits within the context of calculus. The concept of a limit is defined as the value that f(x) approaches as x approaches a certain value 'a'. The presenter uses both numerical and graphical methods to explain limits, providing a clear understanding of how the values of x and f(x) relate as x gets closer to 'a'. A specific example using the function 2x + 1 is given to illustrate how to calculate the limit as x approaches 3, emphasizing the importance of the limit being a unique real number.
📈 Graphical Interpretation of Limits
The second paragraph delves into the graphical approach to finding limits. The presenter demonstrates how to use a graph to determine the limit of a function as x approaches a certain value. By plotting points and observing how the y-values behave as x approaches 3, the presenter shows that the limit can be determined without the need for the function to be defined at the exact point x = 3. This approach is further exemplified with the function y = 2x + 1, highlighting that the limit exists even when the function has a hole at the point in question.
🔍 Analyzing Limits with Piecewise Functions
The third paragraph discusses the application of limit concepts to piecewise functions. The presenter uses a graph to analyze the behavior of a piecewise function as x approaches specific values. The video explains how to determine if the limit exists by looking at the function's behavior from both the left and right sides of the point in question. It is shown that if the left and right limits are equal, the overall limit exists, even if the function has a hole or is undefined at that point.
🤔 Understanding the Existence of Limits
In the fourth paragraph, the presenter clarifies that the existence of a limit does not necessarily mean the function is defined at the point where the limit is taken. Using the function y = 2x + 1 as an example, it is shown that even if the function has a hole at (3,7), the limit as x approaches 3 still exists and is equal to 7. This reinforces the idea that a limit describes the behavior of the function as it approaches a certain point, rather than the value of the function at that point.
📉 Limits and the Behavior of Functions at Infinity
The fifth paragraph explores the concept of limits as x approaches infinity. The presenter explains how to determine the limit of a function when the input becomes extremely large. It is shown that the highest power of x in the function dictates the behavior of the limit. If the powers of x in the numerator and denominator are the same, the limit is a constant. If the power in the denominator is higher, the limit approaches zero. Conversely, if the power in the numerator is higher, the limit goes to infinity.
🔗 Continuity and Discontinuity in Functions
The sixth paragraph introduces the concept of continuity in functions. A function is considered continuous at a point if the function value exists, the limit exists at that point, and both are equal. The presenter uses graphical examples to illustrate continuity and discontinuity, showing that a function may be continuous over certain intervals but not over the entire graph. The importance of understanding where a function is continuous or discontinuous is emphasized, as this knowledge is necessary for further calculus work.
📘 Summary of Limit Concepts and Continuity
The final paragraph summarizes the key points of the lesson on limits and continuity. The presenter encourages students to practice solving problems from sections 1.1 and 1.2, and to apply the concepts learned to determine the behavior of functions, especially at points where the function may have holes or jumps. The video concludes with an invitation for students to ask questions during live sessions and to utilize the practice exercises for exam preparation.
Mindmap
Keywords
💡Limit
💡Derivative
💡Graphical Approach
💡Numerical Approach
💡Piecewise Function
💡Continuity
💡Asymptote
💡Rational Function
💡Two-Sided Limit
💡Undefined Limit
💡Horizontal Asymptote
Highlights
The definition of a limit is introduced as the value that f(x) approaches as x approaches a certain value, denoted as 'lim (x -> a) f(x) = L'.
A numerical and graphical approach to understanding limits is presented, emphasizing the importance of the function's behavior as it approaches a specific point.
The concept of a unique real number L is explained as a requirement for the limit, meaning the function must approach only one value as x approaches a.
An example using the function f(x) = 2x + 1 is provided to illustrate how to find the limit as x approaches 3 both numerically and graphically.
The distinction between a left-hand limit and a right-hand limit is clarified, showing that for the limit to exist, both must be equal and the function value at that point is not required to exist.
Graphical representation of limits is demonstrated, showing how the value of Y approaches a certain value as X approaches a from both the left and right sides.
The existence of a limit does not depend on the function being defined at the point in question, as shown with the example of y = 2x + 1 with x ≠ 3.
Piecewise functions are discussed in the context of limits, showing how to determine limits from a graph for different segments of the function.
The importance of two-sided limits is emphasized, noting that if the left and right limits are not equal, the limit does not exist at that point.
The concept of continuity is introduced, explaining that a function is continuous at a point if the function value exists, the limit exists, and both are equal.
Discontinuities are identified through graphical examples, highlighting jumps and holes in the graph as points where the function is not continuous.
The limit of a constant function is shown to be the constant itself, as it does not change regardless of the value of x that approaches.
An algebraic method for finding limits is demonstrated, where plugging in the value of x into the function can yield the limit if it results in a real number.
Indeterminate forms, such as 0/0, are discussed, explaining that such forms do not inherently mean the limit does not exist, but require further analysis.
The behavior of limits as x approaches infinity is discussed, showing how the highest power of x in the numerator and denominator determines the limit's value.
Three scenarios for limits as x approaches infinity are outlined: when the powers are the same, when the bottom power is larger, and when the top power is larger, each resulting in a constant, 0, or infinity respectively.
The practical application of limits in determining the end behavior of functions and their continuity is emphasized through various graphical examples and exercises.
Transcripts
Browse More Related Video

5.0 / 5 (0 votes)
Thanks for rating: