Exponential Functions!
TLDRThe video script delves into the concept of exponential functions, contrasting them with polynomials and rational functions. It emphasizes that exponential functions are defined by the form f(x) = b * a^x, where 'a' is a positive constant and 'b' can be any real number. The script clarifies that 'a' must be greater than zero to avoid imaginary numbers and that 'b' represents the y-intercept of the function. It further explains that when 'a' is greater than one, the function increases, and when 'a' is between zero and one, it decreases. The special case where 'a' equals one results in a constant function. The video also explores how the value of 'a' affects the steepness of the graph, with closer values to one leading to flatter graphs and further values resulting in steeper increases or decreases. The script concludes with a discussion on how to algebraically solve for the function given two points on the graph and touches on real-world applications, such as exponential decay in carbon dating and population growth.
Takeaways
- 📈 Exponential functions are defined as f(x) = b * a^x, where a > 0 and b and x can be any real numbers.
- 🚫 The base 'a' is restricted to be greater than zero to avoid issues with imaginary numbers when 'x' is not an integer.
- 📍 The value 'b' represents the y-intercept of the graph, which occurs at the point (0, b).
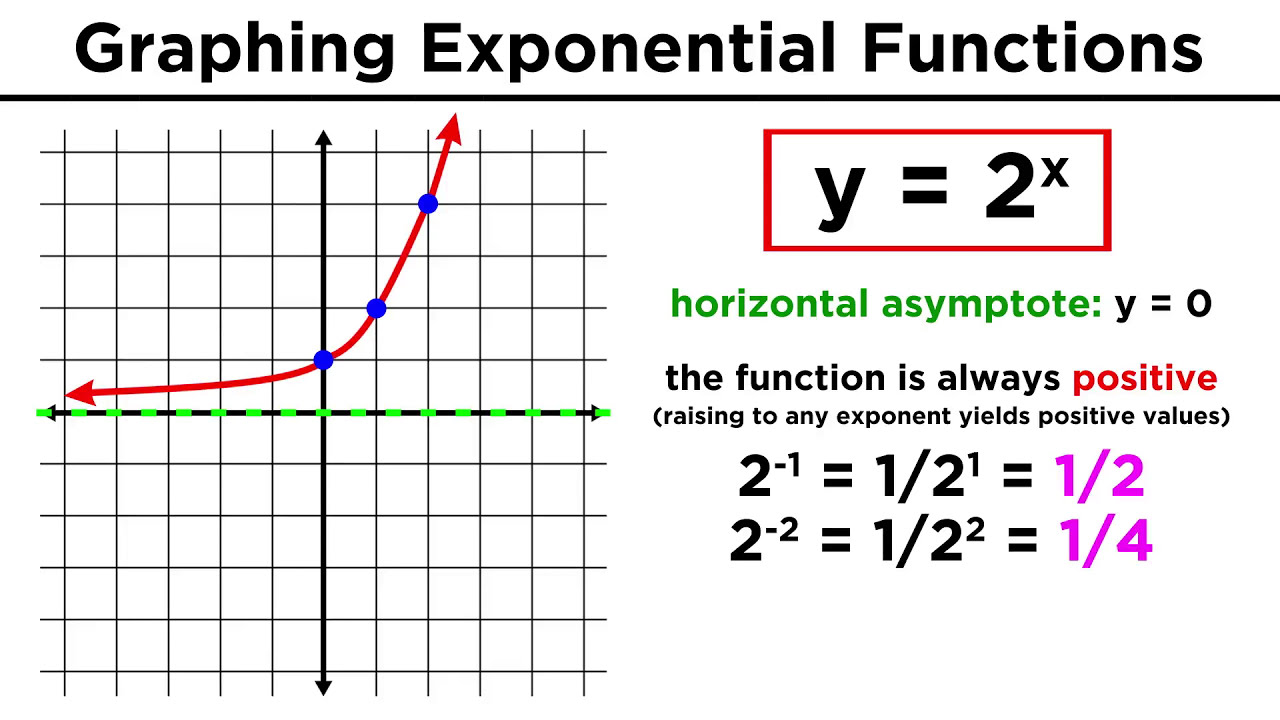
- 🔺 When 'a' is greater than 1, the function f(x) is increasing, and the graph gets steeper as 'a' gets larger.
- 🔻 Conversely, when 'a' is between 0 and 1, the function f(x) is decreasing, and the graph becomes steeper as 'a' approaches 0.
- 🏡 For the special case where 'a' equals 1, the function f(x) becomes a constant line at y = b.
- 🤔 The closer the base 'a' is to 1, the flatter the graph becomes, approaching a constant line.
- 🤓 The further 'a' is from 1, the steeper the graph, showing how 'a' affects the steepness or flatness of the function's graph.
- 🔄 Exponential functions with a base between 0 and 1 can be rewritten as a positive base to the power of a negative exponent to help visualize the function.
- 🔢 By using two points on the graph, one being the y-intercept, you can solve for 'a' and 'b' in the function f(x) = b * a^x.
- 🌱 Exponential functions are useful for modeling real-world scenarios such as population growth and exponential decay, like in carbon dating.
- 🎓 The next topic to be covered is the derivative of these exponential functions, which is a fundamental concept in calculus.
Q & A
What is an exponential function?
-An exponential function is a mathematical function of the form f(x) = b * a^x, where 'a' is a constant greater than zero and 'x' is the variable.
Why is 'a' in the exponential function restricted to be greater than zero?
-'a' is restricted to be greater than zero to avoid issues with negative exponents and imaginary numbers, which can complicate the function's domain.
What is the significance of 'b' in the exponential function?
-'b' represents the y-intercept of the exponential function, which is the value of the function when x equals zero.
How does the value of 'a' affect the graph of the exponential function?
-If 'a' is greater than one, the graph is increasing. If 'a' is between zero and one, the graph is decreasing. If 'a' equals one, the function is a constant line.
What happens to the graph of the exponential function as 'a' approaches one?
-As 'a' approaches one from either side, the graph becomes flatter, approaching a constant line.
What happens to the graph of the exponential function as 'a' moves away from one?
-As 'a' moves away from one, the graph becomes steeper, indicating a more rapid increase or decrease.
How can you represent an exponential function with a base between 0 and 1 as one with a base greater than one?
-You can rewrite the base as its reciprocal raised to the power of negative 'x', effectively reflecting the graph across the y-axis.
How can you solve for the constants 'a' and 'b' in an exponential function if given two points on the graph?
-You can use the points to create two equations and solve the system of equations. The y-intercept (when x=0) directly gives 'b', and the other point can be used to solve for 'a'.
What are some real-world applications of exponential functions?
-Exponential functions are used to model situations involving successive percent increases or decreases, such as population growth, compound interest, and exponential decay in processes like carbon dating.
How can you determine the slope or steepness of an exponential function from its equation?
-The steepness or slope of the graph is determined by the base 'a'. The larger the base (greater than 1), the steeper the graph, and the smaller the base (between 0 and 1), the shallower the graph.
What is the general strategy for finding the equation of an exponential function given a word problem?
-Identify two points that the function passes through, which can often be found by looking for conditions specified in the problem. Then, use these points to find the values of 'a' and 'b'.
Outlines
📈 Introduction to Exponential Functions
This paragraph introduces the concept of exponential functions, contrasting them with polynomials and rational functions which involve coefficients and powers of x. The focus is on the general form of an exponential function, f(x) = b * a^x, where 'a' is a positive constant and 'b' can be any real number. It explains the restriction of 'a' being greater than zero to avoid complex numbers and discusses the role of 'b' as the y-intercept. The paragraph also explores how the value of 'a' affects the direction and steepness of the graph of the function, with 'a' > 1 leading to an increasing function, 'a' < 1 leading to a decreasing function, and 'a' = 1 resulting in a constant function.
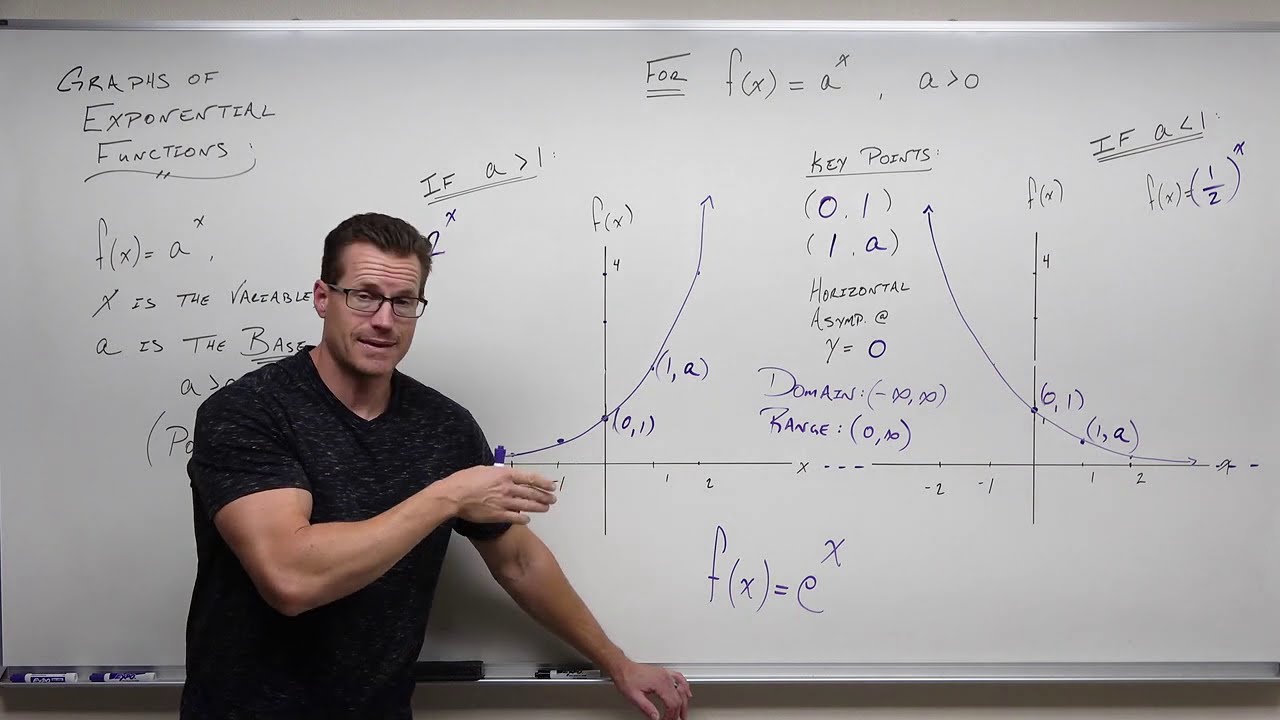
📊 Graphing Exponential Functions
This paragraph delves into the graphical representation of exponential functions with different values of 'a'. It explains that as 'a' approaches 1, the graph becomes flatter, resembling a constant function, while as 'a' moves away from 1, the graph becomes steeper. The paragraph provides examples of graphing functions with 'a' values of 2, 3, 1/2, and 1.3, illustrating how the graph's behavior changes with these values. It also discusses the relationship between functions with 'a' between 0 and 1 and those with 'a' greater than 1, noting that the former can be rewritten as a negative exponent of a larger base to better visualize the inverse relationship across the y-axis.
🔍 Solving Exponential Functions Algebraically
The final paragraph discusses how to algebraically solve for the parameters 'a' and 'b' of an exponential function given two points on its graph. It uses the points (0, 2) and (2, 8) to demonstrate how to find the values of 'b' and 'a'. The paragraph shows that 'b' can be determined from the y-intercept and 'a' can be found by solving an equation derived from the second point. It concludes by emphasizing the utility of exponential functions in modeling real-world scenarios such as exponential decay and population growth, and teases the topic of derivatives for these functions in a future discussion.
Mindmap
Keywords
💡Exponential function
💡Y-intercept
💡Domain
💡Increasing function
💡Decreasing function
💡Constant function
💡Graph
💡Algebraic manipulation
💡Inverse relationship
💡Successive percent increases/decreases
💡Word problem
Highlights
The concept of exponential functions is introduced as an extension of polynomials and rational functions.
Exponential functions are defined as f(x) = b * a^x, where a > 0 and b and x can be any real number.
The restriction a > 0 avoids domain issues such as dealing with imaginary numbers.
The value of b represents the y-intercept of the function, occurring when x = 0.
The behavior of the function (increasing or decreasing) is determined by the value of a.
If a > 1, the function f(x) tends to increase; if 0 < a < 1, it tends to decrease.
The case where a = 1 results in a constant function, f(x) = b, which is not typically considered exponential.
The closer the value of a is to 1, the flatter the graph of the function becomes.
The further a gets away from 1, the steeper the graph of the function.
Graphs of functions with different values of a are visualized to show increasing and decreasing behavior.
Exponential functions with a between 0 and 1 can be rewritten as a^x = b^(-x) for easier visualization.
The relationship between functions with a > 1 and those with 0 < a < 1 is discussed, showing they are inversely related.
An algebraic method is presented to solve for the function given two points on the graph.
The y-intercept (b) can be found by using a point with an x-coordinate of zero.
The value of a can be determined by using a second point on the graph and solving the resulting equation.
The requirement that a > 0 ensures that only positive solutions for a are considered.
Exponential functions are applicable in describing real-world scenarios such as exponential decay and population growth.
The video concludes with a teaser for the next topic, which will cover the derivation of exponential functions.
Transcripts
Browse More Related Video
Graphs of Exponential Functions (Precalculus - College Algebra 52)

Ch. 4.1 Exponential Functions
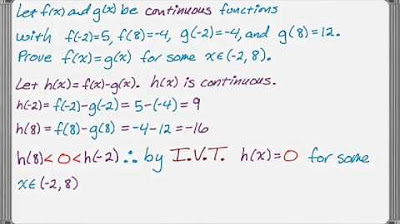
Using the Intermediate Value Theorem Examples
Evaluating and Graphing Exponential Functions
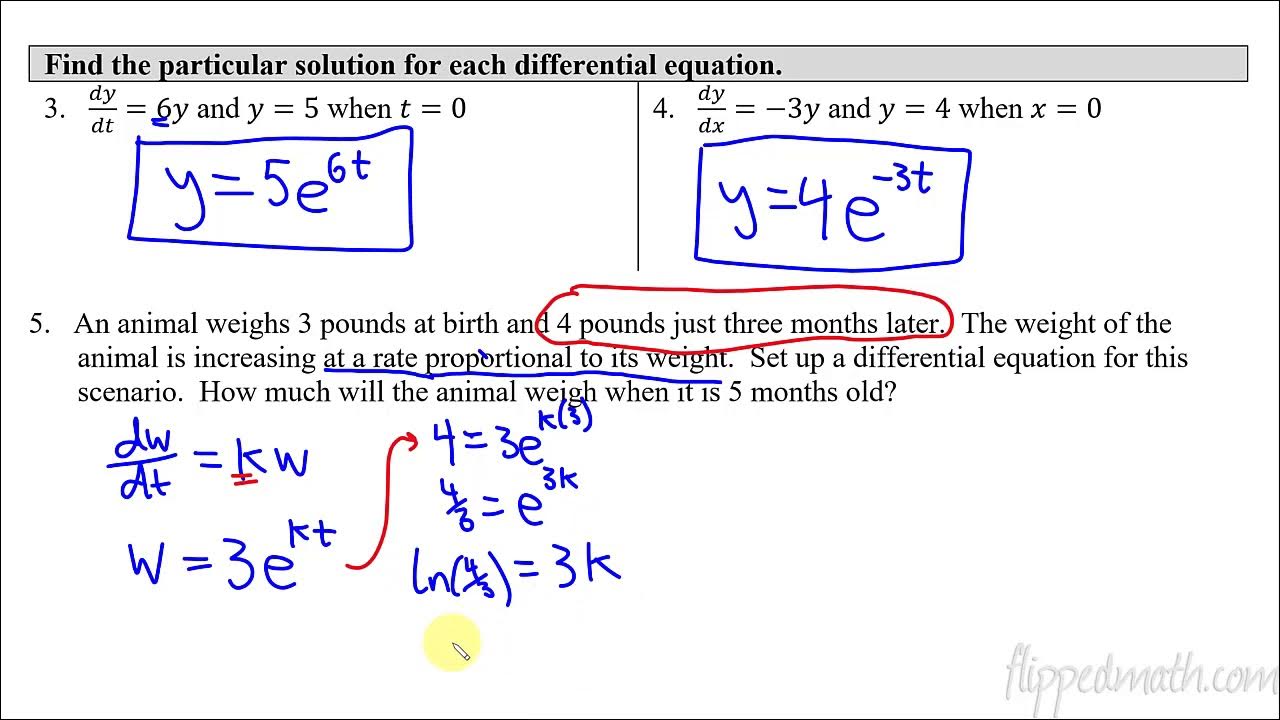
Calculus AB/BC – 7.8 Exponential Models with Differential Equations

Interpreting graphs with slices | Multivariable calculus | Khan Academy
5.0 / 5 (0 votes)
Thanks for rating: