Statistics 101: Linear Regression, Residual Analysis
TLDRThis video delves into residual analysis, a crucial aspect of simple linear regression that assesses model fit and appropriateness. Residuals, the difference between observed and predicted values, reveal insights about error and distribution patterns. The video explains concepts such as homoscedasticity and heteroscedasticity, and discusses the implications of residual patterns, including the need for model adjustments or transformations. It also mentions statistical tests for residuals and encourages further exploration of these topics in advanced statistics and data science.
Takeaways
- 📊 Residual analysis is a method used to evaluate how well a regression model fits the data and whether the model is appropriate for the data set.
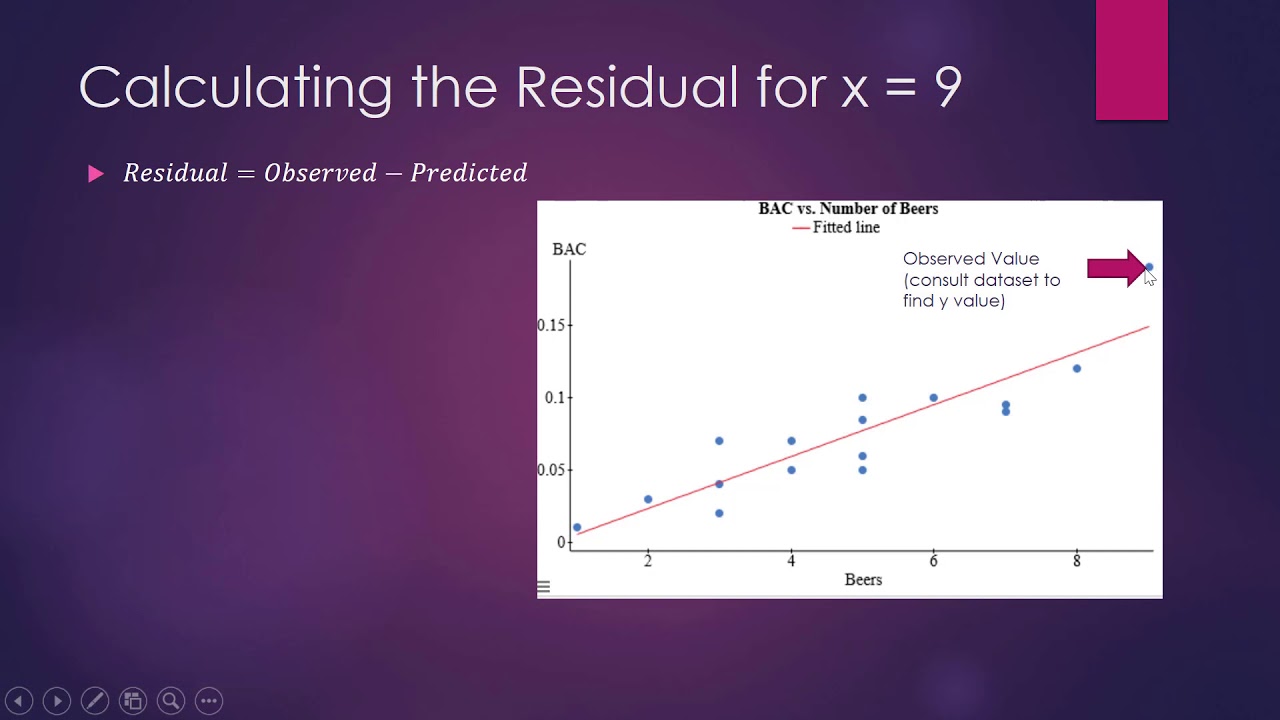
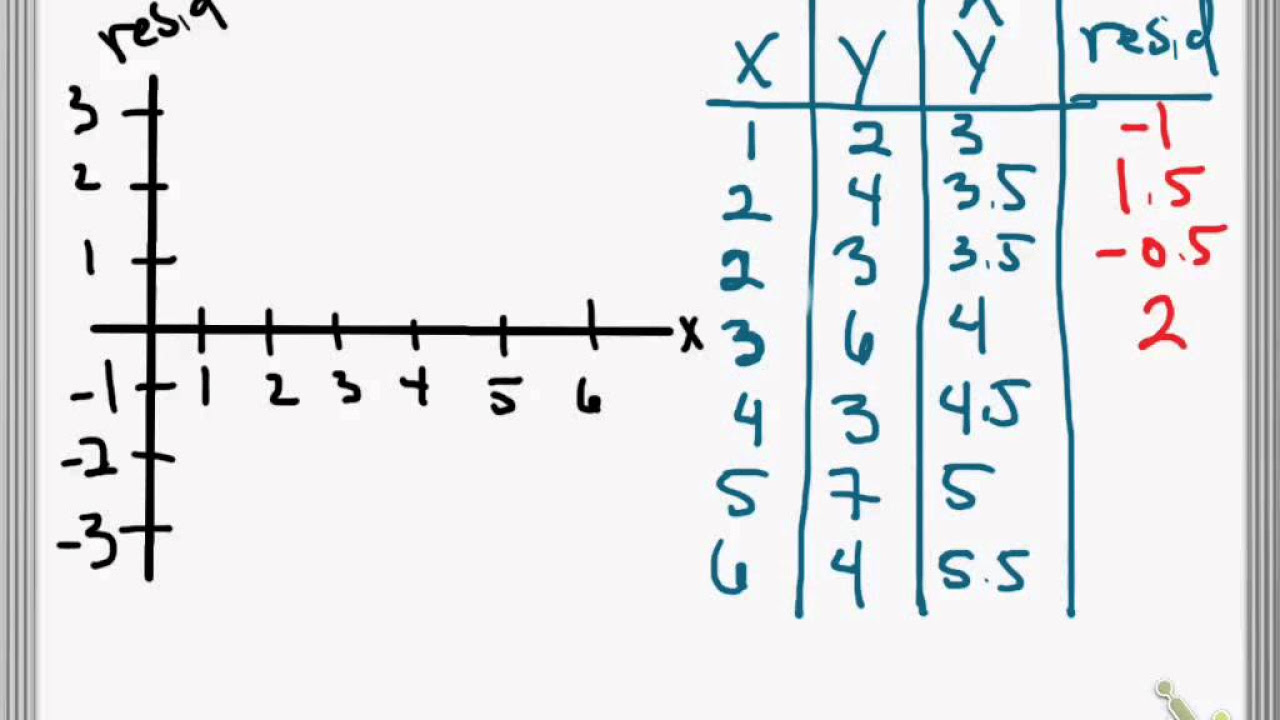
- 🧐 A residual is the difference between the observed value and the predicted value by the regression model, essentially what's left after the model has explained the data.
- 📈 The key purpose of residual analysis is to assess the model's fit and to determine if the model is suitable for the data, going beyond basic statistics into data science and machine learning.
- 🔢 The equation for the total sum of squares (SST) is the difference between individual observed values and the mean of observed values, squared and summed up.
- 🔢 The sum of squares due to error (SSE) is the difference between observed values and predicted values, squared and summed up, representing the error in the model.
- 🔢 The sum of squares due to regression (SSR) is the difference between predicted values and the mean of observed values, squared and summed up, showing how much variance is explained by the model.
- 📉 Patterns in residual plots can indicate issues with the model. Even distribution indicates a good fit (homoscedasticity), while non-uniform distribution or a curved pattern suggests heteroscedasticity or non-constant variance.
- 📉 If residual analysis reveals heteroscedasticity, it might indicate the need to rebuild the model with different variables, perform transformations on the data, or fit a non-linear model.
- 🧠 Residuals follow a normal distribution if the model assumptions are correct, and they should be independent of each other with a mean of zero.
- 🔎 Visual inspection of residual plots is crucial for identifying patterns and potential issues with the model fit, though there are also quantitative statistical tests such as the Breusch-Pagan test and the White test.
- 🎓 The video was sponsored by The Great Courses Plus, offering a vast library of video lectures on various subjects, including in-depth courses on statistics.
Q & A
What is the primary purpose of residual analysis in the context of simple linear regression?
-Residual analysis serves two main purposes: it assesses the quality of the model fit to the data by examining the magnitude of the residuals, and it helps determine the appropriateness of the model being used for the given data set.
How does the residual of a data point in a regression analysis relate to the observed and predicted values?
-The residual of a data point is the difference between the observed value of the dependent variable and the predicted value as estimated by the regression model.
What does the slope of the regression line in the provided example represent?
-In the example, a slope of 0.1462 indicates that for every dollar increase in the meal bill (independent variable), the tip amount (dependent variable) is expected to increase by about 15 cents.
What is the significance of the mean of the dependent variable in a residual plot?
-The mean of the dependent variable is represented by a horizontal line in the residual plot, and it serves as a reference point to compare the observed values against the average behavior of the data.
What does it mean when residuals are evenly scattered across a residual plot?
-Evenly scattered residuals across the plot indicate homoscedasticity or constant variance, which means that the error term is uniformly distributed and the model is assumed to be a good fit for the data.
What are some potential actions to take if residual analysis reveals non-constant variance or heteroscedasticity?
-If residual analysis shows heteroscedasticity, one might consider rebuilding the model with different independent variables, applying transformations to the data, or fitting a non-linear regression model.
What is the significance of the Breusch-Pagan test and the White test in the context of residual analysis?
-The Breusch-Pagan test and the White test are quantitative statistical tests used to check for the presence of heteroscedasticity in the residuals, which can indicate that the variance of the error term is not constant across different levels of the independent variable.
How does the graph of residuals against the predicted values help in assessing the model fit?
-Plotting residuals against the predicted values allows us to visually inspect for patterns that might indicate issues with the model fit. Ideally, the residuals should be randomly distributed without any discernible patterns, suggesting a good model fit.
What is the role of The Great Courses Plus in the context of this video script?
-The Great Courses Plus is mentioned as a resource for learning various subjects, including statistics, and is used in the video script as a promotional partner.
What does the term 'R-squared' represent in a regression model?
-R-squared, or the coefficient of determination, represents the proportion of the variance in the dependent variable that is predictable from the independent variable(s) in the model. It is a measure of how well the observed outcomes are replicated by the model.
What is the significance of a residual plot against the independent variable in assessing the model?
-A residual plot against the independent variable helps to identify patterns in the residuals, which can indicate issues such as non-constant variance (heteroscedasticity) or non-linear relationships that the linear model may not adequately capture.
Outlines
📚 Introduction to Simple Linear Regression and Residual Analysis
The video begins with an introduction to the topic of Simple Linear Regression, emphasizing the importance of residual analysis in understanding the fit and appropriateness of a model to data. Brandon, the speaker, welcomes new and returning viewers, and encourages the audience to share the video with others who might benefit from the content. The discussion then shifts to explaining what residual analysis does - it assesses the quality of the model fit and the appropriateness of the model for the given data set. The relevance of residual analysis extends beyond basic statistics into higher-level statistics, data science, and machine learning, aiding in the decision-making process for model selection.
📈 Residual Analysis and its Role in Regression
This paragraph delves deeper into the concept of residual analysis within the context of regression modeling. It explains that residuals represent the difference between the observed and predicted values, using the notation Y sub I minus y-hat sub I. The paragraph also introduces the standard regression model equation, highlighting the role of the intercept and slope, and the presence of an error term. It discusses the concept of variance explained by the model, represented by R-squared, and the unexplained variance, which is attributed to the residuals. The speaker uses a visual representation to explain the concepts of SSE (sum of squares due to error), SST (total sum of squares), and SSR (sum of squares due to regression), which are key components in understanding the distribution of variance in the data.
🧐 Model Assumptions and Residual Patterns
In this paragraph, the speaker outlines several assumptions made in standard regression models, such as the residuals providing the best information about the error term and the expected value of the error term being zero. It also covers the assumption of constant variance of the error term across all values of the independent variable and the independence and normal distribution of the error term. The paragraph then transitions into discussing how to graph residuals and the different patterns they might display, such as homoscedasticity (constant variance) and heteroscedasticity (non-constant variance). The speaker emphasizes the importance of identifying these patterns, as they can indicate issues with the model, such as non-linearity, and guide decisions on how to improve the model fit.
📊 Analyzing Residual Plots and Next Steps
The speaker continues the discussion on residual analysis by presenting residual plots against both the independent variable (bill amount) and the predicted values. The paragraph focuses on interpreting these plots to assess the model's performance. A good residual plot should show no discernible pattern, indicating a well-fit model. The speaker points out that if heteroscedasticity is detected, it might suggest the need for a different model or transformation of the data. The paragraph concludes with mentioning several quantitative statistical tests for residuals, such as the Breusch-Pagan test, the White test, and the NCV test, although it does not delve into these tests in detail. The speaker reiterates the importance of residual analysis in determining the quality and appropriateness of the model and reminds viewers of the broader implications of this analysis in advanced statistics, data science, and machine learning.
Mindmap
Keywords
💡Simple Linear Regression
💡Residual Analysis
💡Error
💡R-squared
💡Homoscedasticity
💡Heteroscedasticity
💡Predicted Values
💡Observed Values
💡Regression Line
💡Centroid
💡The Great Courses Plus
Highlights
Introduction to residual analysis in the context of simple linear regression.
Residual analysis helps determine the quality of the model fit to the data and the appropriateness of the model for the data set.
Residual is the difference between the observed value and the predicted value by the regression model.
The concept of R-squared, which represents the variance explained by the model.
Explaining the three types of sum of squares: SSE (error), SST (total), and SSR (regression).
Model assumptions, including residuals providing the best information about the error term and the normal distribution of the error term.
Visual representation of residuals on a graph or scatter plot.
The importance of residual plots against both the independent variable and the predicted values.
Identifying patterns in residual plots, such as homoscedasticity (constant variance) and heteroscedasticity (non-constant variance).
The potential issue of non-linear data and the implications for model selection.
The concept of over-fitting a model and the importance of avoiding it.
Quantitative statistical tests for residuals, such as the Breusch-Pagan test, the White test, and the NCV test.
The practical applications of residual analysis beyond statistics, including data science and machine learning.
The use of a restaurant tipping scenario to illustrate the application of simple linear regression.
The regression line equation derived from the data set and the interpretation of its slope and intercept.
The impact of residual analysis on deciding the best model for a given application.
The Great Courses Plus as a resource for learning various subjects, including statistics.
Closing thoughts on the significance of residual analysis in understanding the model's performance and suitability.
Transcripts


5.0 / 5 (0 votes)
Thanks for rating: