Residuals
TLDRThe video script explains the concept of residuals in the context of scatter plots, emphasizing their importance in assessing the accuracy of a line of best fit. Residuals, represented as the difference between observed and predicted values, can be positive or negative, indicating whether predictions are too high or too low, respectively. The explanation is straightforward, using visual aids and examples to clarify how residuals are calculated and their implications for the model's fit.
Takeaways
- 📊 Scatter plots are used to visualize the relationship between two variables.
- 🧠 Residuals are the differences between observed and predicted values in a scatter plot.
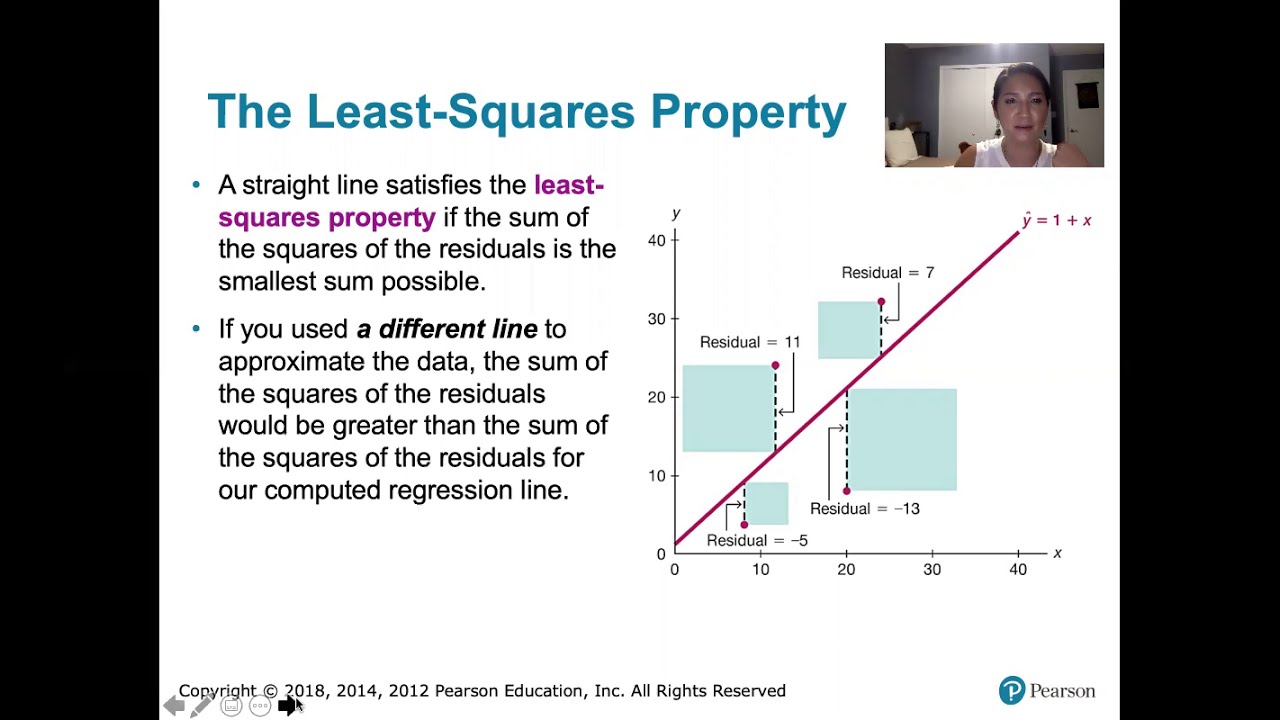
- 📈 The best fit line is an estimation that tries to minimize the residuals.
- 🔍 Observed values are the actual data points collected from a real-world scenario.
- 🔢 Predicted values are the values on the best fit line that we estimate the data points should be near.
- 💥 A residual is calculated by subtracting the predicted value from the observed value.
- 📉 A negative residual indicates that the predicted value is higher than the observed value.
- 📈 A positive residual indicates that the predicted value is lower than the observed value.
- 🔍 Analyzing residuals can help determine the accuracy of a predictive model.
- 👍 Understanding residuals is crucial for improving the fit of a model to data.
- 📚 Residual analysis is an essential part of regression analysis and data interpretation.
Q & A
What is the main topic of discussion in the script?
-The main topic of discussion in the script is the concept of residuals in the context of Scatter Plots.
What is a scatter plot?
-A scatter plot is a graphical representation used to display values for two variables for a set of data, where each data point is represented as a dot on a Cartesian coordinate system.
What is the purpose of a line of best fit in a scatter plot?
-The purpose of a line of best fit in a scatter plot is to estimate the relationship between two variables by finding the line that minimizes the sum of the squares of the vertical distances (residuals) of the points from the line.
What is a residual in the context of a scatter plot?
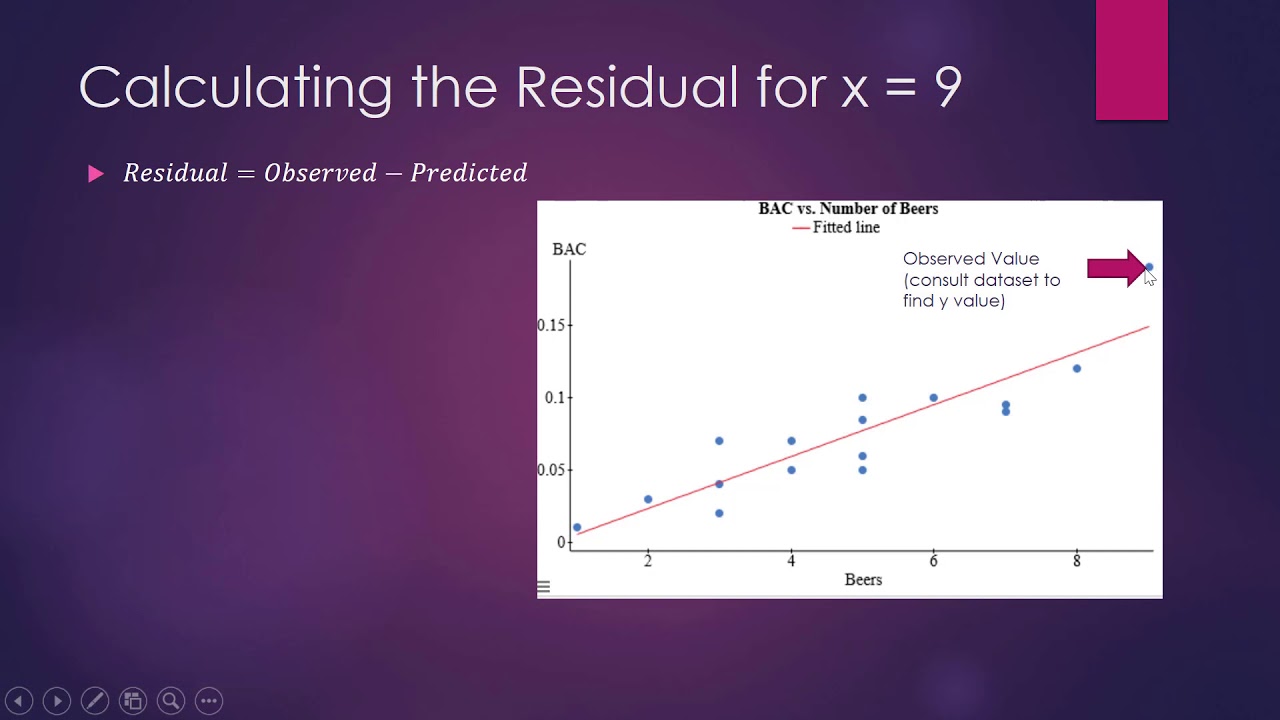
-A residual is the difference between the observed value and the predicted value for a data point in a scatter plot. It is calculated as the observed value minus the predicted value.
How do you calculate a residual for a given data point?
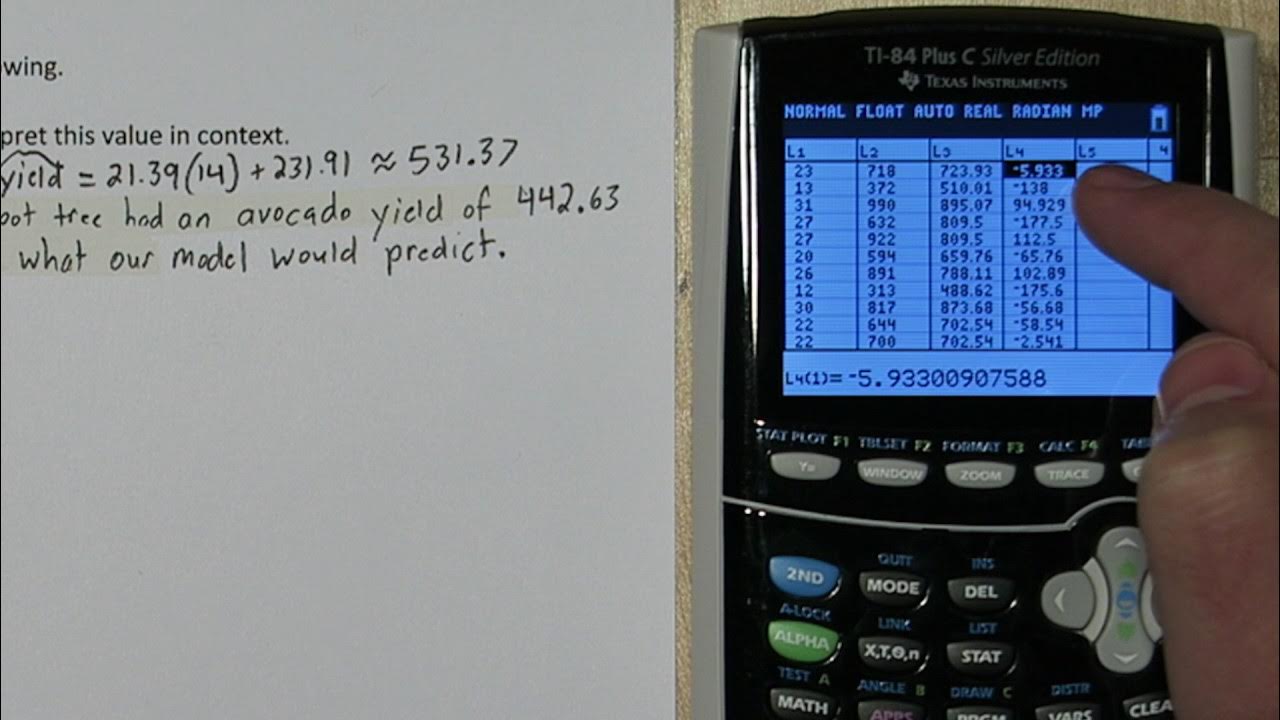
-To calculate a residual for a given data point, you subtract the predicted value (from the line of best fit) from the observed value of that point.
What are the two types of residuals and what do they indicate?
-The two types of residuals are positive and negative. A positive residual indicates that the predicted value is too low, while a negative residual indicates that the predicted value is too high.
What does a negative residual signify about the prediction?
-A negative residual signifies that the prediction is too high, meaning the predicted value is above the actual observed value for that data point.
What does a positive residual signify about the prediction?
-A positive residual signifies that the prediction is too low, meaning the predicted value is below the actual observed value for that data point.
Why are residuals important in data analysis?
-Residuals are important in data analysis because they help to assess the accuracy and quality of a predictive model. By analyzing residuals, one can identify patterns or outliers that may suggest issues with the model or indicate data points that do not conform to the overall trend.
How can the analysis of residuals help improve a predictive model?
-The analysis of residuals can help improve a predictive model by revealing areas where the model's predictions are consistently too high or too low. This information can be used to adjust the model, refine the line of best fit, and ultimately improve the model's predictive accuracy.
What is the significance of the distance between observed and predicted points in a scatter plot?
-The distance between observed and predicted points in a scatter plot, represented by the residuals, is significant as it measures the error of the predictions. A smaller distance indicates a more accurate model, while larger distances suggest greater prediction errors.
Outlines
📊 Understanding Residuals in Scatter Plots
This paragraph introduces the concept of residuals in the context of scatter plots. It explains that residuals are the differences between the observed values and the predicted values derived from a line of best fit. The speaker clarifies that the observed values are the raw data points on the scatter plot, while the predicted values are the points where the line of best fit intersects with the data points. The explanation includes a demonstration of how to calculate a residual by subtracting the predicted value from the observed value, highlighting that the distance between these two points represents the residual. The paragraph also touches on the implications of positive and negative residuals, indicating that a negative residual suggests an overestimated prediction, while a positive residual indicates an underestimated prediction.
🔢 Further Explanation of Positive and Negative Residuals
This paragraph delves deeper into the implications of positive and negative residuals. It emphasizes that a negative residual indicates the predicted value is higher than the actual observed value, using a hypothetical example where the predicted Y value is 15 while the observed Y value is 10, resulting in a negative residual of -5. Conversely, a positive residual means the predicted value is lower than the observed value, illustrated with an example where the observed Y value is 8 and the predicted Y value is 4, leading to a positive residual of 4. The summary underscores the importance of understanding these concepts for accurately interpreting scatter plots and the predictions made from them.
Mindmap
Keywords
💡Scatter Plots
💡Residuals
💡Line of Best Fit
💡Observed Values
💡Predicted Values
💡Positive Residual
💡Negative Residual
💡Data Points
💡Best Fit
💡Predicted Y Value
💡Observed Y Value
Highlights
The concept of residuals is introduced in the context of Scatter Plots.
Residuals are the differences between observed and predicted values.
A scatter plot typically involves a line of best fit.
The line of best fit is influenced by all data points in the scatter plot.
Data points on the line of best fit represent the predicted values.
To find a residual, subtract the predicted value from the observed value.
A residual can be positive or negative, indicating whether the prediction is too high or too low.
A negative residual indicates that the predicted value is higher than the observed value.
A positive residual indicates that the predicted value is lower than the observed value.
The process of finding residuals involves estimating a line of best fit and comparing individual data points to it.
Residuals are a measure of how well the predicted values fit the actual observed data.
Understanding residuals is crucial for assessing the accuracy of a predictive model.
The explanation provides a clear and straightforward method for calculating and interpreting residuals.
The use of visual aids, such as smiley faces, helps to illustrate the concept of residuals effectively.
The discussion on residuals is part of a broader statistical analysis technique used in data science and research.
The transcript offers practical insights into the application of residuals in analyzing scatter plots.
Transcripts
Browse More Related Video


5.0 / 5 (0 votes)
Thanks for rating: