Statistics 101: Linear Regression, The Very Basics 📈
TLDRThis video introduces the concept of simple linear regression, emphasizing its foundational role in statistical analysis. The host, Brandon, explains that regression models the relationship between variables using algebra, and without additional variables, the mean of the dataset serves as the best predictor. He illustrates this with a restaurant tipping scenario, where the variability in tips is explained solely by the tips themselves. The video also touches on the concept of residuals and the sum of squared residuals (SSE), highlighting that the goal of regression is to minimize the SSE, thereby improving the model's fit to the data.
Takeaways
- 🌟 Stay positive and patient when facing challenges in learning statistics, as perseverance and practice can lead to understanding and success.
- 🎯 The purpose of this video series is to introduce basic concepts of simple linear regression in a slow and deliberate manner, suitable for beginners.
- 📈 Simple linear regression models the relationship between two variables: an independent variable and a dependent variable, using algebra.
- 🤔 The quality of a regression model is judged by comparing it to a model where the independent variable is ignored, and only the mean of the dependent variable is used for prediction.
- 📊 Data visualization is crucial in understanding and solving problems, as it helps to make sense of the data and relationships between variables.
- 🔢 In the absence of the independent variable, the mean of the dependent variable is used as the best predictor for future observations.
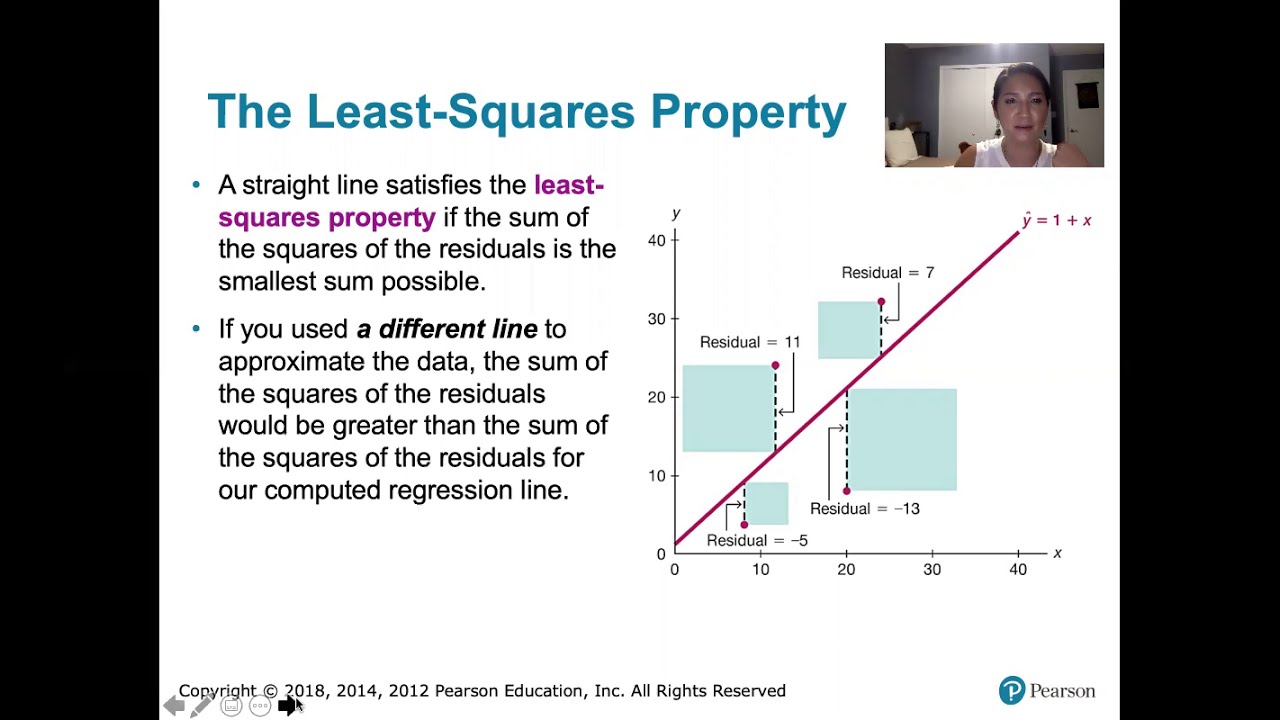
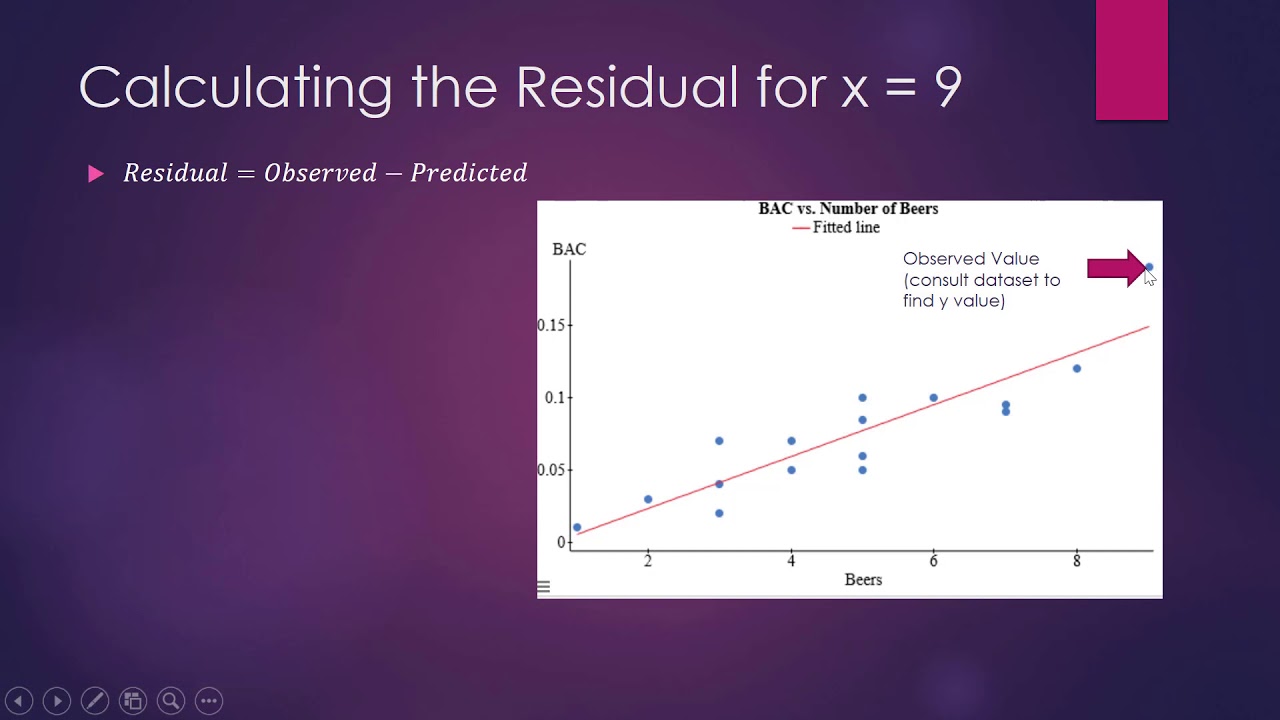
- 📝 Residuals represent the difference between the observed values and the predicted values (mean or best fit line), and are a measure of the model's accuracy.
- ✅ Squaring the residuals is done to make all values positive and to emphasize larger deviations, which is useful in calculating the sum of squared residuals (SSE).
- 🏆 The goal of simple linear regression is to find the best fit line that minimizes the SSE, which indicates how well the model fits the data.
- 🔄 The introduction of the independent variable aims to reduce the SSE and improve the model's predictive power compared to using only the mean of the dependent variable.
- 🚀 Further videos in the series will build upon this foundation, exploring the introduction of the independent variable and its impact on the regression model.
Q & A
What is the main topic of the video?
-The main topic of the video is basic statistics, specifically focusing on the introduction to simple linear regression.
What is the first advice given by Brandon for viewers struggling with statistics?
-Brandon advises viewers to stay positive, keep their head up, and have faith in their abilities, as hard work, practice, and patience can help them overcome their challenges.
How can one follow Brandon's content?
-One can follow Brandon on YouTube, Twitter, Google Plus, or LinkedIn to stay updated with his new videos and connect with him online.
What does Brandon suggest doing if you like the video?
-If you like the video, Brandon suggests giving it a thumbs up, sharing it with classmates or colleagues, or adding it to a playlist to support and encourage him to keep making content.
What is the purpose of the 'tips for service' real-world problem discussed in the video?
-The 'tips for service' problem is used to illustrate how one might predict the tip amount for future meals using only the tip data collected, without the corresponding meal amounts.
What is the best prediction for the next meal's tip amount based on the given data?
-The best prediction for the next meal's tip amount, given the data, is the mean of the collected tips, which is $10.
What do the residuals represent in the context of the video?
-In the context of the video, residuals represent the differences or deviations between the observed tip amounts and the mean tip amount (best fit line).
Why are residuals squared in the process of analyzing data?
-Residuals are squared for two reasons: to make all values positive, regardless of their original sign, and to emphasize larger deviations by exaggerating the impact of points that are further away from the mean.
What is the sum of squared residuals (SSE)?
-The sum of squared residuals (SSE) is the total of all squared residuals, which is a measure used to assess how well the best fit line approximates the observed data points.
What is the goal of simple linear regression according to the video?
-The goal of simple linear regression is to create a linear model that minimizes the sum of squares of the residuals, also known as the sum of squares of the error (SSE).
How is the goodness of fit for a regression model determined?
-The goodness of fit for a regression model is determined by comparing the sum of squares of the residuals (SSE) of the model to the SSE that would result if only the mean of the dependent variable were used for prediction.
What will be the focus of the next video in the series?
-The next video in the series will continue exploring simple linear regression, likely introducing the independent variable and its role in creating a better fit line for predicting tip amounts based on meal amounts.
Outlines
🎓 Introduction to Basic Statistics and Simple Linear Regression
The video begins with an introduction to basic statistics and simple linear regression. The speaker, Brandon, encourages viewers who may be struggling with their class to stay positive and reminds them of their potential. He also invites viewers to follow him on various social media platforms for updates on new content. The video's purpose is to cover the basics of simple linear regression, explaining the concept in a slow and deliberate manner to ensure understanding of not just 'what' is happening, but also 'why' and 'how' to apply it. Brandon emphasizes that the content is aimed at individuals new to statistics and that the video will not delve into complex formulas or calculations, but rather introduce the underlying concepts and terminology.
🍴 Real World Problem: Tips for Service
The speaker introduces a real-world problem related to predicting tip amounts in a restaurant setting. He presents a hypothetical scenario where a restaurant owner or server collects data on tips from six meals, only to realize that they have collected the tip amounts without corresponding meal amounts. The challenge is to predict future tip amounts using only the tip data available. Brandon suggests visualizing the data to understand the relationship between the tip amounts and to use the mean of the tips as the best prediction for future tips. He emphasizes that with only one variable, the mean is the best estimate for any given tip amount.
📊 Visualizing Data and Understanding Residuals
In this section, Brandon discusses the importance of visualizing data, specifically through the creation of a graph with meal numbers on the x-axis and tip amounts on the y-axis. He explains that the meal numbers are merely descriptors and not variables. The graph reveals data points that represent the tip amounts for each meal. Brandon then introduces the concept of residuals, which are the differences between the observed values and the mean of the tips (the best fit line in this case). He explains that these residuals, when squared and summed, become the sum of squared residuals (SSE), a measure of how well the data fits the line. The video emphasizes that the residuals always add up to zero and that squaring them emphasizes larger deviations from the mean.
📉 Minimizing Sum of Squares: The Goal of Simple Linear Regression
Brandon explains that the primary goal of simple linear regression is to create a linear model that minimizes the sum of squares of the residuals, also known as the sum of squared errors (SSE). He clarifies that this goal is achieved by introducing an independent variable that, when combined with the dependent variable, creates a best fit line that minimizes the SSE as much as possible. The video highlights that when comparing the fit of a regression model, it is compared to a scenario where only the dependent variable is considered, using its mean as the best prediction. The speaker also notes that if the introduction of an independent variable does not improve the fit of the model, it implies that the variable does not add any explanatory power to the dependent variable.
🎯 Summary of Simple Linear Regression Concepts
In the concluding part of the video, Brandon summarizes the key concepts discussed. He reiterates that simple linear regression is about comparing two models: one where only the mean of the dependent variable is used for predictions, and another where a best fit line is created by introducing an independent variable. The video emphasizes that the best fit line in regression minimizes the SSE, providing a better fit to the data than using just the mean. Brandon assures viewers that the best fit line found through regression is indeed the best line that reduces the SSE, though the calculus behind this is not discussed in detail. He reminds viewers that the introduction of the independent variable in a two-variable regression model should reduce the error and improve the prediction of the dependent variable.
Mindmap
Keywords
💡Statistics
💡Linear Regression
💡Independent Variable
💡Dependent Variable
💡Mean
💡Residual
💡Sum of Squared Residuals (SSR or SSE)
💡Best Fit Line
💡Visualization
💡Goodness of Fit
💡Standard Deviation
Highlights
The video series focuses on basic statistics and simple linear regression.
The speaker encourages viewers to stay positive and believes in their ability to overcome challenges.
The importance of visualizing data through charts and graphs is emphasized.
The concept of an independent variable and a dependent variable is introduced.
The video explains that the quality of a regression model is compared to a specific model.
Basic terminology and concepts related to regression are introduced for newcomers.
A real-world problem about predicting tips in a restaurant is presented.
The video demonstrates how to visualize data with only one variable.
The mean of the sample is used as the best predictor for the next measurement when only one variable is available.
The concept of residuals and errors is introduced to measure the distance from the best fit line.
The sum of squared residuals (SSE) is explained as a measure of the goodness of fit.
Simple linear regression aims to find the best fitting line that minimizes the SSE.
The goal of regression is to reduce the unexplained error compared to using only the mean of the dependent variable.
The video lays the foundation for understanding the comparison between a regression line and the mean of the dependent variable.
The introduction of an independent variable is teased for the next video, promising a deeper dive into regression analysis.
The video concludes by reinforcing the importance of understanding the comparison between models in regression analysis.
Transcripts
Browse More Related Video
10.2.5 Regression - Residuals and the Least-Squares Property
Introduction to residuals and least-squares regression | AP Statistics | Khan Academy
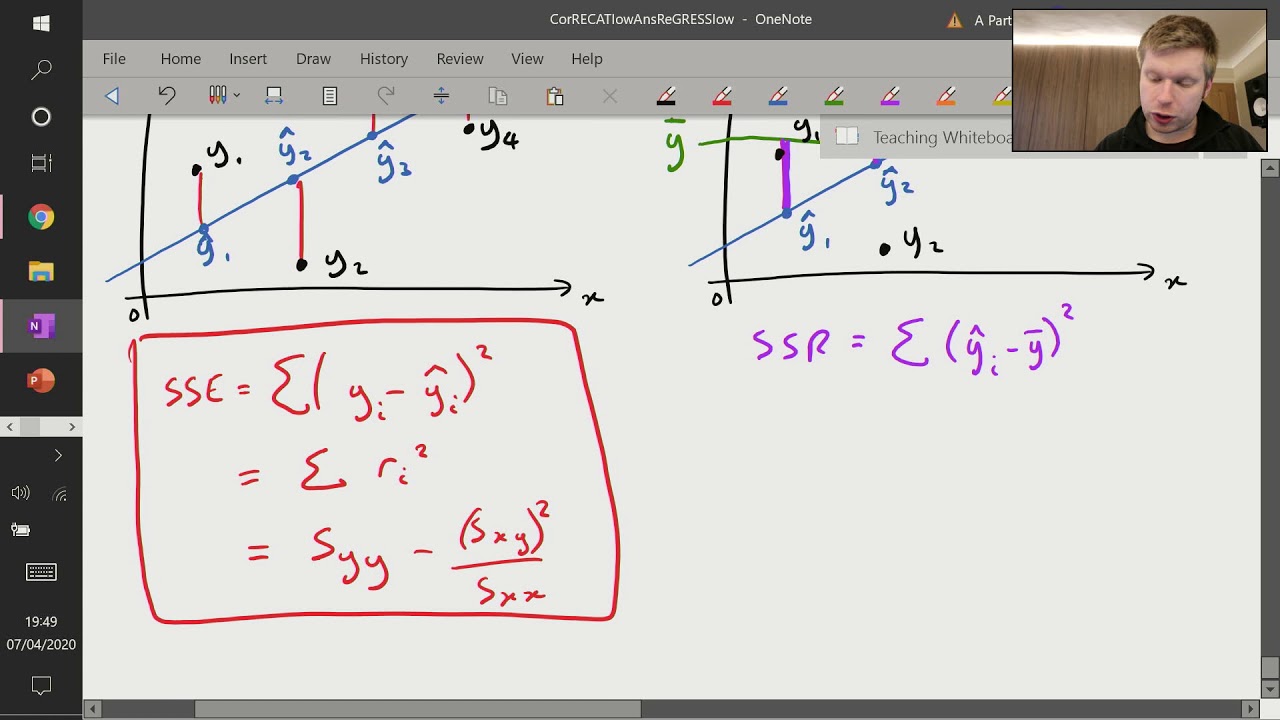
Correlation and Regression (6 of 9: Sum of Squares - SSE, SSR and SST)
Introduction to REGRESSION! | SSE, SSR, SST | R-squared | Errors (ε vs. e)
How to Calculate the Residual
Introduction to residuals and least squares regression
5.0 / 5 (0 votes)
Thanks for rating: