Introduction to REGRESSION! | SSE, SSR, SST | R-squared | Errors (ε vs. e)
TLDRJustin Seltzer introduces the fundamentals of regression in a series of videos, starting with the core concepts. He discusses the relationship between two variables, using the example of bar takings and temperature, and explains how to transform visual patterns into equations. The video covers key elements such as the line of best fit (Y hat), the process of minimizing the sum of squared errors to find the Y hat line, and the distinction between explained and unexplained deviations. It also touches on the calculation of total sum of squares (SST), regression sum of squares (SSR), and residual sum of squares (SSE), as well as the concept of R-squared. The script concludes with a look at error terms and the population regression function, differentiating between theoretical error terms and those from the sample regression line.
Takeaways
- 📊 Regression analysis is a statistical method used to examine the relationship between two variables, typically focusing on the impact of one variable on another.
- 🌡️ The given example in the script explores the relationship between bar takings and temperature, hypothesizing that higher temperatures lead to increased revenue.
- 📈 The foundation of regression is the line of best fit, also known as Y hat, which predicts the value of Y for a given X, aiming to minimize the error terms.
- 🔢 The sample regression line equation is introduced with a constant term (intercept) and a coefficient for X, both of which are estimates derived from the data.
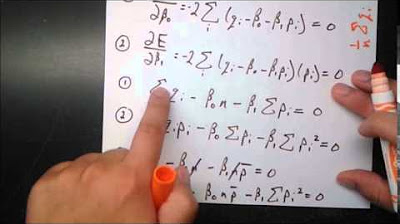
- 🏆 The method for finding the best fit line involves minimizing the sum of squared errors, turning a visual generalization into a quantifiable equation.
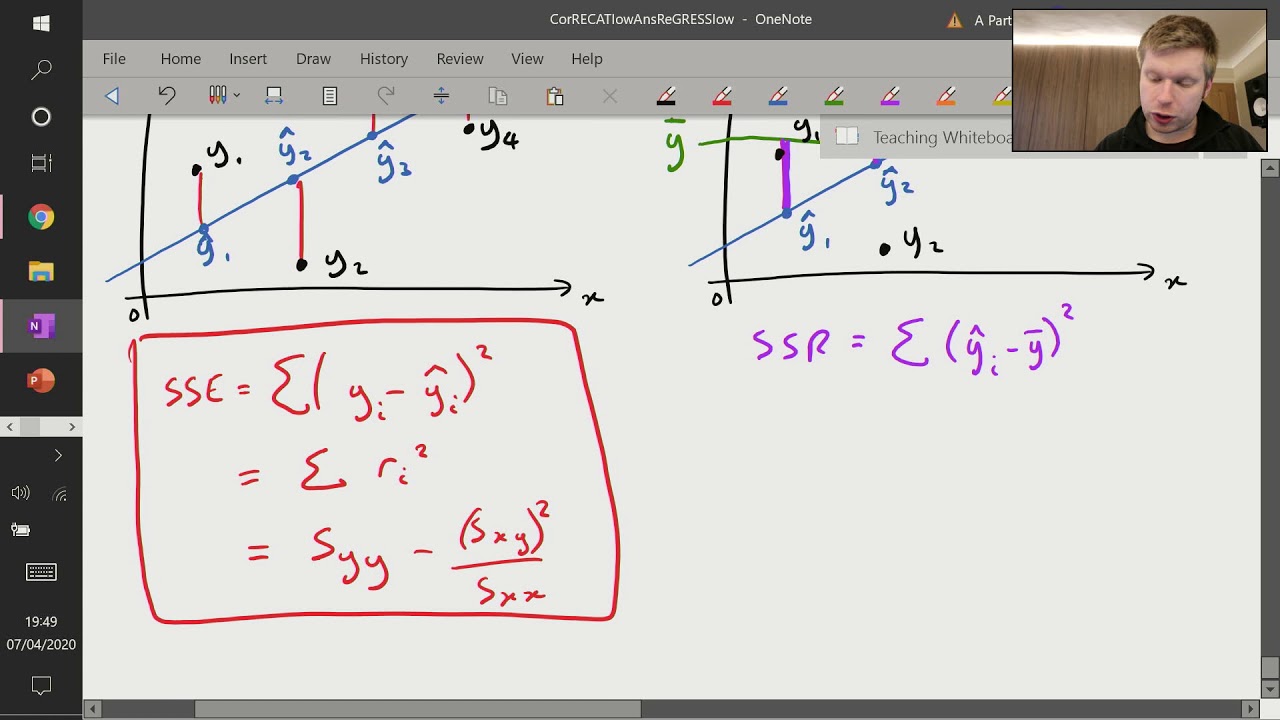
- 🔍 The script explains the concept of total sum of squares (SST), regression sum of squares (SSR), and residual sum of squares (SSE), which are key components in understanding the variance in data.
- 📊 The Y bar line represents the mean value of Y, and deviations from this mean are split into explained (by the model) and unexplained (residual) parts.
- 🔸 R-squared is introduced as a measure of how well the regression line fits the data, representing the proportion of total variation explained by the model.
- 🔄 The script highlights that different samples can yield different regression lines, emphasizing that these lines are estimates of the true underlying relationship.
- 🌐 The population regression function is mentioned, explaining that it represents the true relationship between variables, which can only be estimated but never precisely known.
- 🚦 Error terms are distinguished between the theoretical error (Curley error term) and the sample error (lowercase e), with the latter being calculable and the former existing only in theory.
Q & A
What is the main topic of Justin Seltzer's video series?
-The main topic of Justin Seltzer's video series is regression, with the first video focusing on the foundations of regression.
What is the purpose of the first video in the series?
-The purpose of the first video is to introduce the nuts and bolts of regression, making it suitable for those who are new to the concept, while also providing a different perspective for those who are already familiar with it.
What is the example used in the video to illustrate the concept of regression?
-The example used in the video is the relationship between bar takings and temperature on Friday nights during June and July.
How does the video demonstrate the positive relationship between bar takings and temperature?
-The video demonstrates the positive relationship by showing a scatter plot with bar takings on the y-axis and temperature on the x-axis, indicating that higher temperatures are associated with higher bar takings.
What is the equation of the sample regression line provided in the video?
-The equation of the sample regression line is $Y = -350 + 3.11X + 120$.
What does the Y hat line represent in regression?
-The Y hat line represents the predicted value of Y for a given value of X, also known as the line of best fit.
How are the constants and coefficients of the regression line determined?
-The constants and coefficients are determined by minimizing the sum of the squared errors, which is the difference between the observed values and the predicted values on the regression line.
What are SST, SSR, and SSE in the context of regression?
-SST (Total Sum of Squares) represents the total variation from the mean, SSR (Regression Sum of Squares) represents the explained variation, and SSE (Residual Sum of Squares) represents the unexplained variation.
What does R-squared indicate in regression analysis?
-R-squared indicates the proportion of the total variation in the dependent variable that is predictable from the independent variable(s).
What is the difference between the lowercase 'e' error term and the Curley error term in regression?
-The lowercase 'e' error term represents the distance from the sample regression line to the observed values, which can be calculated and minimized. The Curley error term represents the theoretical distance from the population regression function to each observation, which cannot be calculated but exists in theory.
What does the video suggest about the relationship between the size of SSE and the value of R-squared?
-The video suggests that a smaller SSE (lower sum of squared errors) leads to a higher R-squared value, indicating a better fit of the model to the data.
What will be the focus of the next video in the series?
-The next video in the series will focus on degrees of freedom, a concept that many people find challenging.
Outlines
📊 Introduction to Regression
Justin Seltzer introduces the concept of regression in a series of videos, starting with the foundational aspects. This first video aims to provide a basic understanding of regression, especially for those new to the topic, while also offering a fresh perspective for those already familiar with it. The video discusses a specific example of bar takings related to temperature, using a scatter plot to illustrate a positive relationship between the two variables. The goal is to transform this visual observation into a tangible equation and assess the strength of the relationship between the variables.
📈 Minimizing Sum of Squared Errors
The video segment delves into the process of finding the line of best fit, known as Y hat, by minimizing the sum of squared errors. It explains that while the raw error terms can cancel each other out, squaring them eliminates this issue, allowing for the identification of a unique line that minimizes the sum of squared errors. The segment introduces the concepts of Total Sum of Squares (SST), Regression Sum of Squares (SSR), and Residual Sum of Squares (SSE), highlighting their roles in understanding the variation in data and the fit of the regression model. A brief introduction to R-squared is also provided, emphasizing its importance in measuring the proportion of total variation explained by the model.
🔢 Error Terms and Population Regression Function
This part of the video script discusses the concept of error terms in regression analysis. It differentiates between the sample error terms (lowercase e) and the theoretical error term (curly E). The sample error terms represent the distance from the observed values to the sample regression line, which can be calculated and minimized. On the other hand, the theoretical error term represents the distance from each observation to the true population regression function, which cannot be known or calculated. The video emphasizes the assumption of a true relationship between variables that can be estimated, and it introduces the population regression function to explain this concept. The segment concludes by discussing the estimation of the true relationship from a new sample, highlighting the variability in the regression line estimates.
Mindmap
Keywords
💡Regression
💡Line of Best Fit
💡Y hat (Ŷ)
💡Scatter Plot
💡Coefficient
💡Sum of Squared Errors (SSE)
💡Total Sum of Squares (SST)
💡Explained and Unexplained Deviation
💡R-squared
💡Population Regression Function
💡Error Terms
Highlights
Justin Seltzer introduces a series of videos on regression, starting with the foundational concepts.
The video aims to present regression from a potentially different angle than traditional lectures and textbooks, making it more intuitive.
A sample dataset of bar takings and corresponding temperatures on Friday nights from June and July is used to illustrate the concepts.
The positive relationship between bar takings and temperature is demonstrated through a scatter plot, supporting the theory that higher temperatures may lead to higher bar profits.
The concept of the line of best fit, or Y hat, is introduced as a way to predict Y for a given value of X.
The sample regression line equation is provided, highlighting the constant term (intercept) and the coefficient of X (slope).
The method of minimizing the sum of squared errors to find the line of best fit is explained, emphasizing the importance of squaring the errors to eliminate negative values.
Total sum of squares (SST), regression sum of squares (SSR), and residual sum of squares (SSE) are defined, showing how they relate to each other and the concept of explained and unexplained deviations.
R-squared is introduced as a measure of the proportion of total variation explained by the model, with a discussion on its interpretation and significance.
The difference between the population regression function and the sample regression line is clarified, along with the concepts of beta naught and beta one.
The distinction between the theoretical error term (epsilon) and the sample error term (e) is explained, highlighting their roles in estimating the true relationship and measuring deviation from the sample regression line.
The video concludes with a teaser for the next video on degrees of freedom, a topic that many find challenging.
The importance of understanding the foundational concepts of regression is emphasized for both beginners and those looking to deepen their understanding.
The practical application of regression in predicting business outcomes, such as bar profits based on temperature, is showcased.
The process of transforming a visual generalization into a quantifiable equation is discussed, providing a framework for turning observations into actionable insights.
The video provides a comprehensive overview of key regression concepts, including the line of best fit, regression equation, and the sum of squares, in an accessible manner.
Transcripts
Browse More Related Video
Correlation and Regression (6 of 9: Sum of Squares - SSE, SSR and SST)

How to calculate a regression equation, R Square, Using Excel Statistics
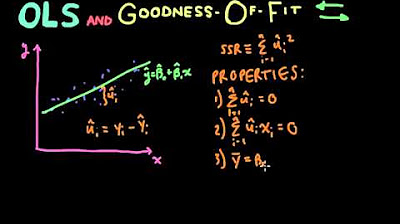
Econometrics // Lecture 3: OLS and Goodness-Of-Fit (R-Squared)
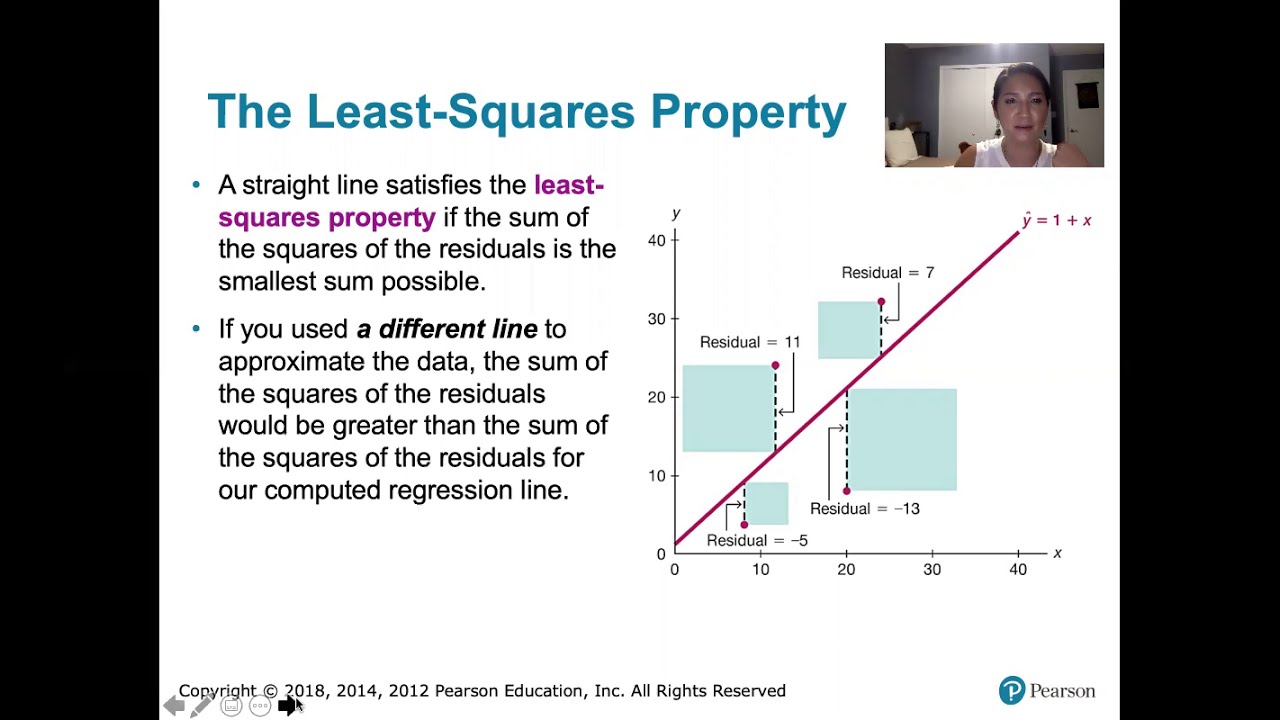
10.2.5 Regression - Residuals and the Least-Squares Property
What is R-Squared (R^2) ... REALLY?
Ordinary Least Squares Regression
5.0 / 5 (0 votes)
Thanks for rating: