Correlation and Regression (6 of 9: Sum of Squares - SSE, SSR and SST)
TLDRThe video script discusses the concept of least squares regression, focusing on minimizing residuals to find the best fit line through a data set. It introduces three key quantities for quantifying error: the sum of squares error (SSE), the sum of squares regression (SSR), and the total sum of squares (SST). The script explains how these are calculated and how they relate to each other, emphasizing that smaller errors indicate a better fit of the data to the regression line.
Takeaways
- 📊 The video discusses building upon previous concepts related to data analysis and regression lines.
- 🧠 The main goal of the video is to understand how to quantify the error in a regression line through different methods.
- 🔍 The concept of 'residuals' is introduced as the difference between actual and estimated data values.
- 🏁 The method of 'least squares regression' is used to minimize the sum of the squares of these residuals.
- 📐 The formula for the sum of the squares error (SSE) is explored in detail, as a measure of the error in the model.
- 🔢 The video explains how to calculate the mean of the data values and how it relates to the sum of squares regression (SSR).
- 📈 The 'total sum of squares' (SST) is introduced as a combination of the sum of squares error and the sum of squares regression.
- 🔄 The relationship between the different types of errors (SSE, SSR, SST) is discussed, and their formulas are derived.
- 🎯 The importance of minimizing these errors is emphasized to improve the fit of the data to the regression line.
- 📋 The formulas for calculating sxx, sYY, and sXY are provided as the foundation for the error calculations.
- 📝 The video concludes by highlighting that the sum of the squares total (SST) can be calculated as sYY, and the sum of the squares regression (SSR) can be expressed as sXY squared divided by sXX.
Q & A
What is the main goal of the video?
-The main goal of the video is to build upon previous concepts and delve deeper into understanding how to quantify errors in a regression line, specifically using the concepts of sum of squares error (SSE), sum of squares regression (SSR), and sum of squares total (SST).
What is the least squares regression line?
-The least squares regression line is a line that minimizes the sum of the squares of the residuals (differences between the actual data values and the estimated data values). It is derived by choosing values of a and B to minimize the sum of the squares error (SSE).
How is the sum of squares error (SSE) calculated?
-The sum of squares error (SSE) is calculated by taking the differences between the actual data values (yi) and the estimated data values (ŷi), squaring each of these differences, and then summing them up.
What is the formula for the sum of squares error (SSE)?
-The formula for the sum of squares error (SSE) is given by: SSE = Σ(yi - ŷi)^2, where yi represents the actual data values and ŷi represents the estimated data values.
What is the sum of squares regression (SSR)?
-The sum of squares regression (SSR) measures the difference between the estimated data values (ŷi) and the mean of the dependent variable (ȳ). It is calculated by squaring these differences and summing them up.
How is the sum of squares total (SST) derived?
-The sum of squares total (SST) is derived by combining the sum of squares error (SSE) and the sum of squares regression (SSR). It essentially quantifies the total error by considering the variation of the data from the mean, as well as the variation from the regression line.
What is the relationship between SST, SSE, and SSR?
-The sum of squares total (SST) is the total variation in the data, which can be partitioned into the explained variation (SSR) and the unexplained variation (SSE). Mathematically, SST = SSR + SSE.
Why is minimizing the SSE important in regression analysis?
-Minimizing the SSE is important because it indicates how well the regression line fits the data. A smaller SSE means that the estimated values are closer to the actual values, suggesting a better fit of the model to the data.
What does a larger SSR indicate about the regression line?
-A larger SSR indicates that the regression line is further away from the mean of the dependent variable, which suggests that the model is not capturing the underlying trend of the data as effectively as it could be.
How can the concepts of SSE, SSR, and SST be used to evaluate the quality of a regression model?
-By evaluating the values of SSE, SSR, and SST, one can assess the quality of a regression model. Ideally, a good model will have a small SSE (minimized unexplained variation) and a large SSR (explained variation close to the mean), resulting in a small total SST (total variation).
What are the practical implications of the formulas for sxx, syx, and syy in regression analysis?
-The formulas for sxx, syx, and syy are fundamental in regression analysis as they are used to calculate SSE, SSR, and SST. These values are crucial for evaluating the fit of the regression model and making adjustments to improve its accuracy.
Outlines
📊 Introduction to Regression Analysis and Residuals
This paragraph introduces the concept of building upon previous videos to understand the relationship between data points and the regression line. It explains the goal of minimizing residuals, which are the differences between the actual data values and the estimated values on the regression line. The method of least squares regression is introduced as a way to determine the best-fit line through the data points. The paragraph emphasizes the importance of quantifying the error in the regression line through different measures and introduces the first measure, the sum of squares error (SSE), which represents the differences between actual and estimated data values.
📈 Calculation and Interpretation of Sum of Squares Regression
The second paragraph delves into the calculation and interpretation of the sum of squares regression (SSR), which measures the difference between the estimated values and the mean value of the data. It explains how SSR is quantified by squaring the differences between the regression values and the mean value. The paragraph also introduces the concept of total error by combining the sum of squares error and the sum of squares regression. The total error is represented as the sum of squares total (SST), which is derived from the differences between each data point and the mean of all data points. The explanation includes a visual representation of these concepts and their relationship to the regression line and mean value.
🔢 Derivation and Application of Sum of Squares Total (SST)
The final paragraph focuses on the derivation and application of the sum of squares total (SST), which is the combination of the sum of squares error (SSE) and the sum of squares regression (SSR). It provides a mathematical breakdown of how SST can be calculated using the formula s YY - s XY squared divided by s XX. The paragraph emphasizes the importance of minimizing these errors to ensure a good fit of the data to the regression line. It also recaps the formulas for s XX, s YY, and s XY, and how they relate to the different measures of error. The summary highlights the goal of achieving the smallest possible errors to indicate a well-fitted regression line to the data points.
Mindmap
Keywords
💡Regression Line
💡Residuals
💡Least Squares Regression
💡Sum of Squares Error (SSE)
💡Sum of Squares Regression (SSR)
💡Total Sum of Squares (SST)
💡Deviance
💡Estimator
💡Independent Variable
💡Dependent Variable
💡Mean Value
Highlights
Building on previous concepts, the video discusses the process of drawing a regression line through a dataset to minimize residuals.
The regression line, denoted as y hats, is derived by minimizing the sum of squared residuals.
The concept of least squares regression is introduced as a method to determine the best-fit line through a dataset.
Three different ways to quantify the error in a regression line are discussed in the video.
The first method, the sum of squares error (SSE), quantifies the difference between actual and estimated data values.
A formula for the sum of residual squares is provided, which involves the terms s YY, s XY, and s XX.
The video introduces the second method, the sum of squares regression (SSR), which measures the difference between the estimated values and the mean value of the dataset.
The total error is quantified by combining the sum of squares error and the sum of squares regression.
The sum of squares total (SST) represents the total variation in the dataset and is calculated as the sum of the squares error and the squares regression.
A new graph is introduced to visually represent the true data value, the estimated data value, and the mean data value in relation to the independent variable.
The video explains that the sum of squares total can be thought of as the total distance between the extremes, represented as the sum of (y - y bar) squared.
The relationship between SST, SSY, and the other components is mathematically explored, leading to the formula SST = SSY - SSE.
The video concludes that the sum of squares regression is equal to (s XY)^2 divided by s XX, providing a quantifiable measure of the regression line's fit to the data.
The importance of minimizing these errors is emphasized to ensure a good fit of the data to the regression line.
Simple formulas for calculating s XX, s YY, and s XY are provided for easy computation of the error measures.
The video's content is highly educational, offering a comprehensive understanding of quantifying errors in regression analysis.
Transcripts
Browse More Related Video
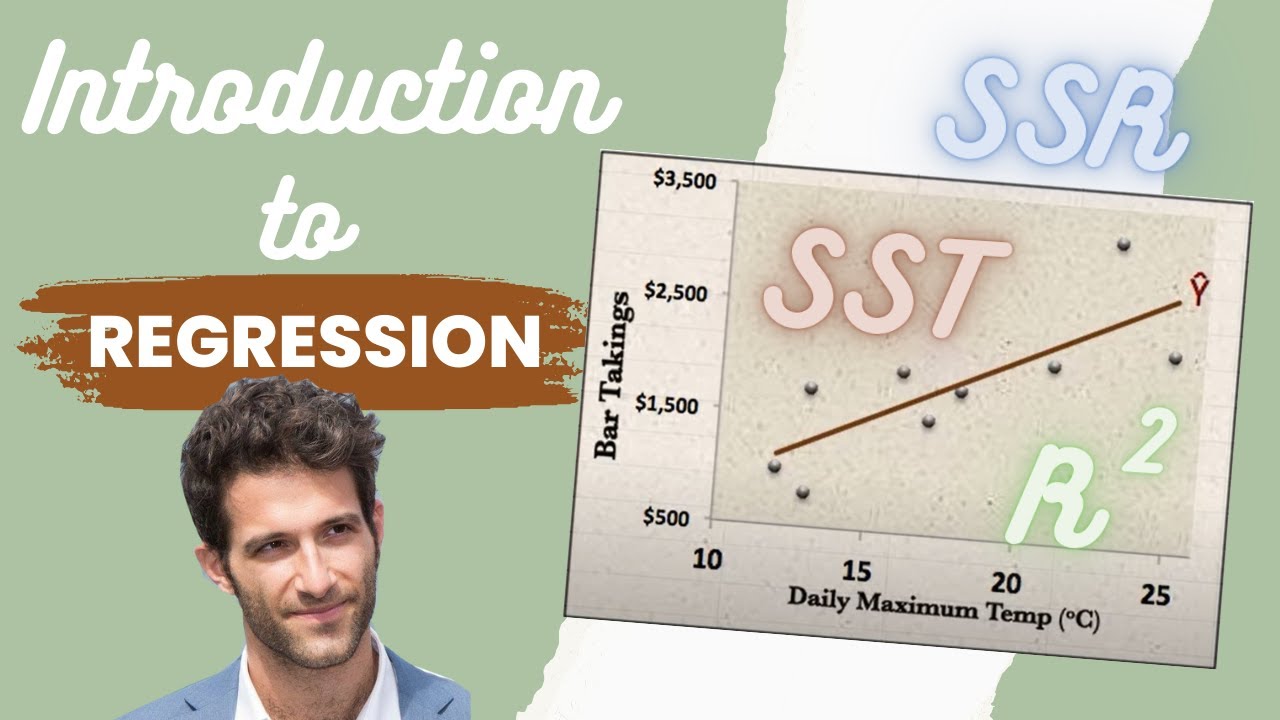
Introduction to REGRESSION! | SSE, SSR, SST | R-squared | Errors (ε vs. e)
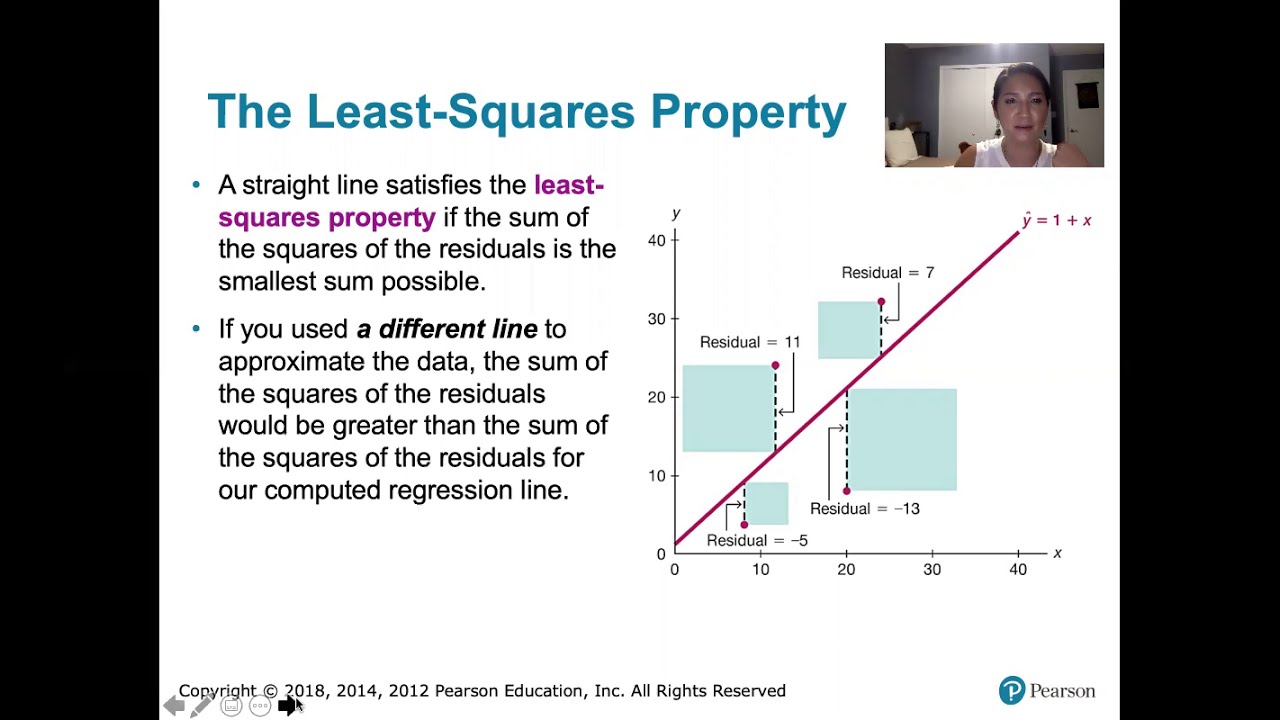
10.2.5 Regression - Residuals and the Least-Squares Property

How to calculate a regression equation, R Square, Using Excel Statistics

Introduction To Ordinary Least Squares With Examples
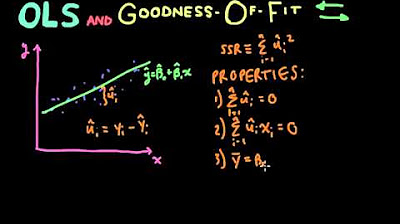
Econometrics // Lecture 3: OLS and Goodness-Of-Fit (R-Squared)
R Squared Explained in 5 minutes
5.0 / 5 (0 votes)
Thanks for rating: