Riemann Sums - Left Endpoints and Right Endpoints
TLDRThis script explains the process of approximating the area under a curve, specifically y=x^2 from 0 to 8, using Riemann sums with left and right endpoints. It demonstrates how increasing the number of rectangles (n) from 4 to 8 improves the accuracy of the approximation, highlighting the concept of under and over estimation. The script also compares these approximations to the exact area calculated using a definite integral, emphasizing the convergence to the true value as n approaches infinity.
Takeaways
- 📈 The script discusses the calculation of the area under the curve of the function y = x^2 from 0 to 8 using rectangles to approximate the area.
- 📐 The process involves dividing the interval [0, 8] into subintervals and using either left or right endpoints to estimate the area under the curve.
- 🔢 The approximation is improved by increasing the number of rectangles (n), leading to a more accurate Riemann sum.
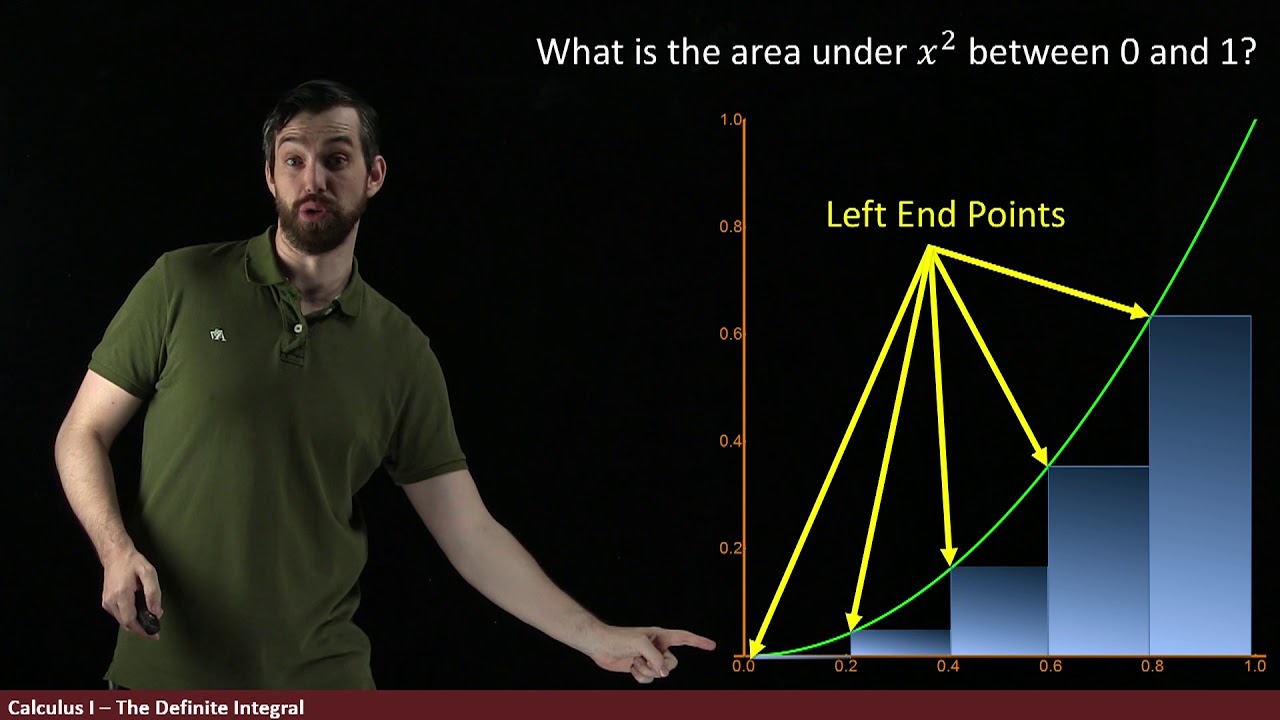
- 📉 Using the left endpoints results in an underestimation of the area, while using the right endpoints results in an overestimation.
- 🔍 The script provides a step-by-step method for calculating the area of each rectangle and summing them up to approximate the total area.
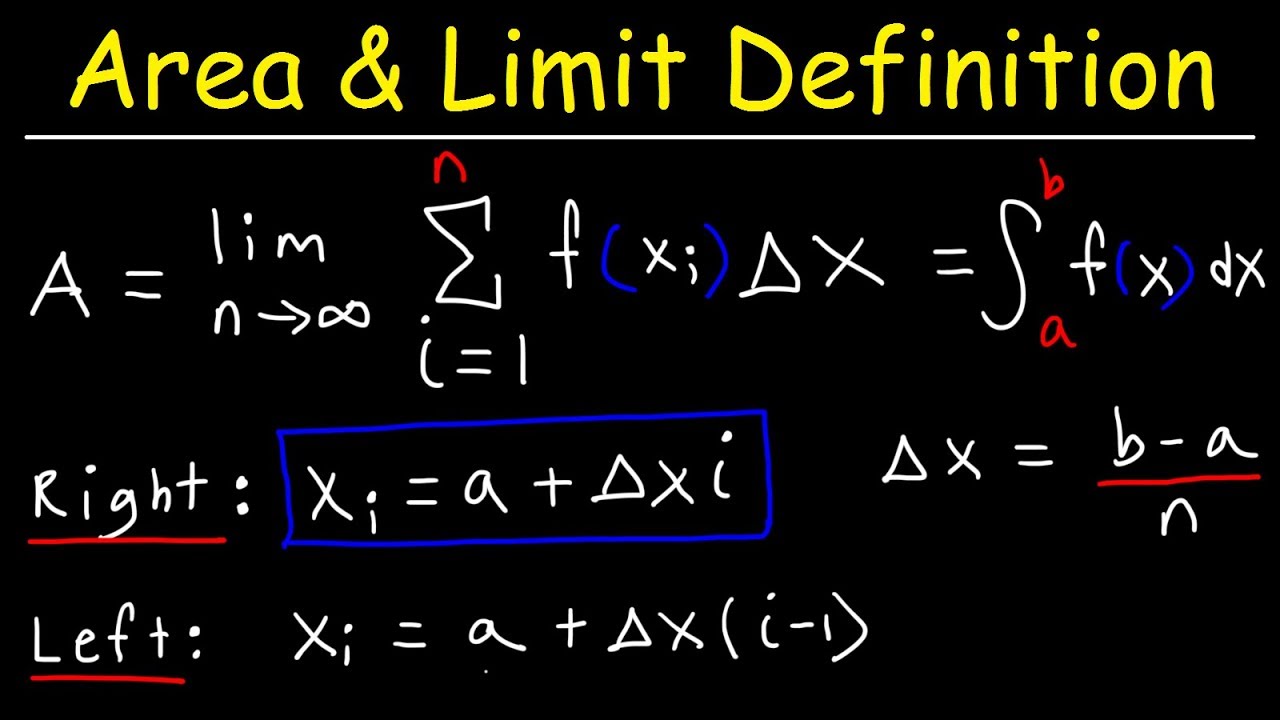
- 🌟 The concept of delta x (∆x) is introduced as the width of each rectangle, calculated as (b - a) / n.
- 📌 The script demonstrates the selection of points on the number line corresponding to the left and right endpoints for different values of n.
- 🧮 The area is calculated by multiplying the width (∆x) by the sum of the function values at the selected endpoints.
- 🏹 The process is repeated for both left and right endpoints, and the results are averaged to get a closer approximation to the actual area under the curve.
- 🌐 The actual area under the curve can be found by evaluating the definite integral of the function, which in this case is ∫(x^2) dx from 0 to 8.
- 🎯 The script concludes that as n approaches infinity, the Riemann sums approximation will become equal to the actual area under the curve.
Q & A
What is the function being discussed in the transcript?
-The function being discussed is y = x^2.
How is the area under the curve approximated using rectangles?
-The area under the curve is approximated by dividing the graph into subintervals and using the height of the function at specific points within each interval, multiplied by the width of the rectangles, which is Δx.
What are the two methods of approximating the area under the curve using rectangles?
-The two methods are using the left endpoints (lower sum) and the right endpoints (upper sum) of the subintervals.
How is the width of each rectangle, Δx, calculated?
-Δx is calculated by dividing the total length of the interval (b - a) by the number of rectangles (n).
What is the significance of using more rectangles (increasing n)?
-Using more rectangles (increasing n) increases the accuracy of the approximation, as the width of each rectangle becomes smaller and the approximation becomes closer to the actual area under the curve.
What is the formula for the exact area under the curve from 0 to 8 for the function y = x^2?
-The exact area is found by evaluating the definite integral of x^2 from 0 to 8, which is (8^3 / 3) - (0^3 / 3), approximately 170.67.
How does the average of the left and right endpoint approximations compare to the actual area?
-The average of the left and right endpoint approximations provides a closer estimate to the actual area under the curve than either approximation alone.
What are the coordinates of the points chosen for the left endpoints when n is 8?
-The points chosen for the left endpoints when n is 8 are 0, 1, 2, 3, 4, 5, 6, and 7.
What are the coordinates of the points chosen for the right endpoints when n is 8?
-The points chosen for the right endpoints when n is 8 are 1, 2, 3, 4, 5, 6, 7, and 8.
What is the area calculated using the left endpoints when n is 8?
-The area calculated using the left endpoints when n is 8 is 140.
What is the area calculated using the right endpoints when n is 8?
-The area calculated using the right endpoints when n is 8 is 204.
Outlines
📊 Calculating Area Under a Curve Using Rectangles
This paragraph introduces the concept of calculating the area under a curve using rectangles as an approximation. It begins with a discussion of the graph of y equals x squared and focuses on finding the area under the curve from zero to eight. The method involves dividing the curve into subintervals and approximating the area with rectangles, using either the left (lower sum) or right (upper sum) endpoints. The process of calculating the area of each rectangle and summing them up to estimate the total area under the curve is explained in detail. The paragraph also introduces the concept of delta x, which represents the width of each rectangle, and the sigma notation for summing the areas. The example provided uses four rectangles to approximate the area, resulting in an underestimation of the actual area.
📐 Determining Left Endpoint Riemann Sums
This paragraph delves into the specifics of calculating the area under the curve using left endpoint Riemann sums. It starts by creating a number line from zero to eight and dividing it into four subintervals, resulting in five points. The four points chosen for the left endpoints are 0, 2, 4, and 6. The process of calculating the area for each rectangle using the left endpoints is outlined, with the height of each rectangle being the function value at the chosen point. The paragraph then sums up the areas of the individual rectangles to provide an approximation of the total area, which is found to be 112. It is noted that this is an underestimation of the actual area, and the concept of right endpoint Riemann sums is introduced as a complementary approach to obtain an overestimation.
🔄 Averaging Left and Right Endpoints for Improved Accuracy
The paragraph discusses the method of averaging the results from left and right endpoint Riemann sums to achieve a more accurate approximation of the area under the curve. It presents the area calculated using the right endpoints, which results in an overestimation of 240. The process of averaging the left and right endpoint areas, resulting in 176, is then explained. The paragraph also introduces the concept of the definite integral as a way to calculate the exact area under the curve, and the integral of x squared from 0 to 8 is evaluated to be approximately 170.67. The paragraph concludes by highlighting the improved accuracy of the approximation when increasing the number of rectangles from four to eight.
🔢 Increasing the Number of Rectangles for Enhanced Approximation
This paragraph explores the impact of increasing the number of rectangles used in the approximation process. By doubling the number of rectangles from four to eight, the accuracy of the left and right endpoint Riemann sums is improved. The paragraph provides a detailed calculation of the area using the left endpoints with eight subintervals, resulting in an area of 140. It then calculates the area using the right endpoints, which is found to be 204. The paragraph organizes the information in a table, comparing the areas calculated using left and right endpoints for both n equals 4 and n equals 8, along with their average and the actual answer. It is observed that as n increases, the approximation becomes closer to the actual area, demonstrating the effectiveness of using more rectangles for a more accurate estimation.
Mindmap
Keywords
💡Graph
💡Area under the curve
💡Rectangles
💡Left endpoints
💡Right endpoints
💡Riemann sums
💡Definite integral
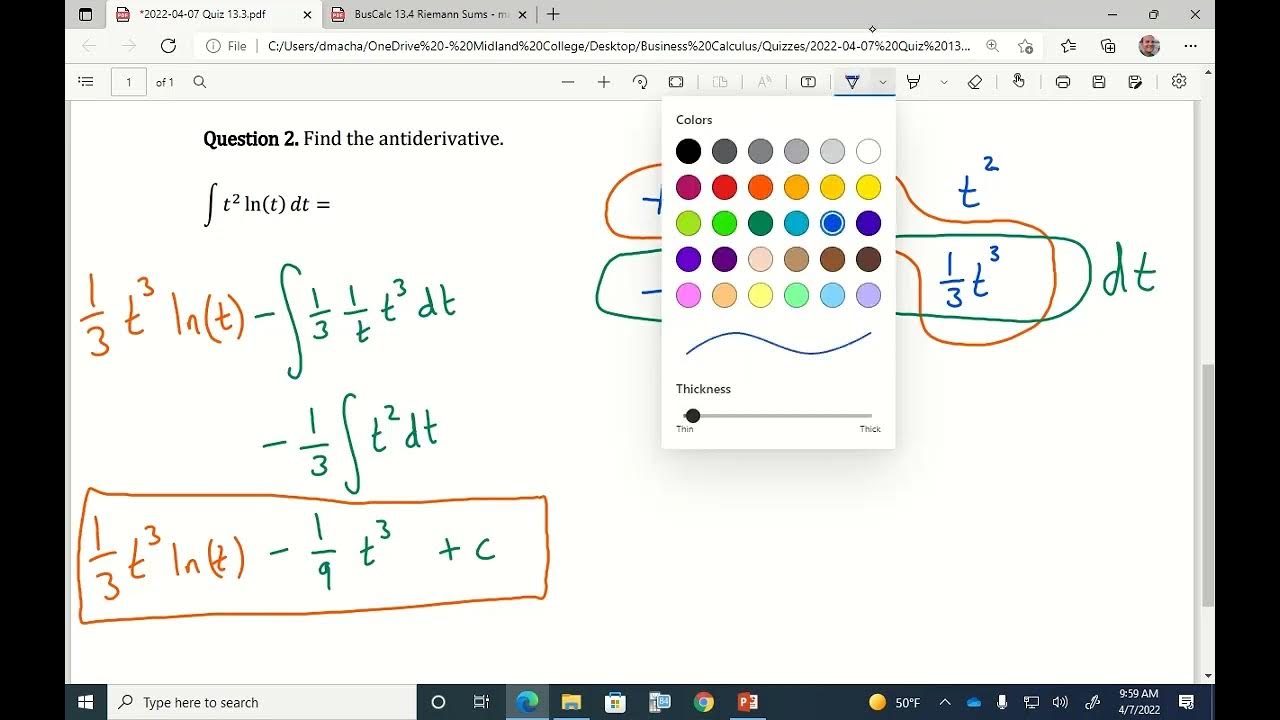
💡Antiderivative
💡Approximation
💡Accuracy
Highlights
The discussion focuses on calculating the area under the curve of y=x^2 from 0 to 8 using rectangles.
Two methods of approximation are introduced: using left endpoints (lower sum) and right endpoints (upper sum).
The initial approximation uses four rectangles to estimate the area, resulting in an underestimation of the true area.
Each rectangle's area is calculated by multiplying its width (delta x) by its height (function value at the endpoint).
The width of each rectangle is determined by dividing the interval from 0 to 8 into four equal parts.
The area calculation using left endpoints results in an approximation of 112, which is less than the actual area.
Using right endpoints results in an overestimation of the area, with a value of 240 when n is 4.
Averaging the left and right endpoint approximations can provide a closer estimate to the actual area.
The exact area under the curve from 0 to 8 is calculated using definite integrals, resulting in approximately 170.67.
Increasing the number of rectangles to eight subintervals improves the approximation, with left endpoints yielding 140 and right endpoints yielding 204.
The average of the left and right endpoint approximations with eight rectangles is 172, closer to the actual area.
As the value of n increases, the accuracy of the Riemann sums approximation improves, approaching the actual area under the curve.
The process demonstrates the concept of Riemann sums and how they can be used to approximate areas under curves.
The antiderivative of x^2 is x^3/3, which is used to evaluate the definite integral for the area calculation.
The video serves as an introduction to Riemann sums and their practical application in approximating areas under curves.
Transcripts
Browse More Related Video
BusCalc 13.4 Riemann Sums

Riemann Sums - Midpoint, Left & Right Endpoints, Area, Definite Integral, Sigma Notation, Calculus

The Definite Integral Part III: Evaluating From The Definition
The Definite Integral Part I: Approximating Areas with rectangles
Finding The Area Using The Limit Definition & Sigma Notation
Calculus - Lesson 13 | Integral of a Function | Don't Memorise
5.0 / 5 (0 votes)
Thanks for rating: