Sample and Population in Statistics | Statistics Tutorial | MarinStatsLectures
TLDRThe video discusses the concepts of samples and populations in statistics, using examples of disease prevalence and height distribution to illustrate how sample data can be used to infer population parameters. It explains the use of sample proportions and means, along with graphical representations like bar plots and histograms. The video also introduces theoretical probability distributions, such as the binomial for categorical data and the normal distribution for numeric data, emphasizing their role in statistical inference for making statements about populations based on sample data.
Takeaways
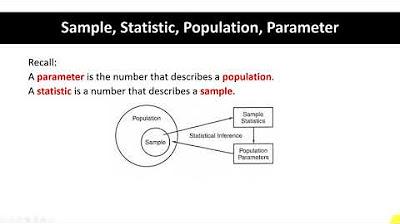
- 🔍 The distinction between a population and a sample is fundamental in statistics, with populations being the entire group of interest and samples being a subset used to make inferences.
- 📊 A sample proportion (p-hat) is used to summarize categorical data, such as the presence or absence of a disease, by calculating the percentage of individuals with the characteristic in the sample.
- 📈 Bar plots are useful for visualizing the distribution of categorical data, showing the proportion of individuals with and without the characteristic of interest.
- 🎯 The theoretical probability distribution, such as the binomial distribution for binary outcomes, models the likelihood of observing different outcomes in the entire population.
- 📐 When the true probability of an event is known, such as the true disease prevalence, statistical models like the binomial distribution can describe the population's distribution.
- 📊 For numeric variables like height, the sample mean and standard deviation are calculated to summarize the central tendency and dispersion of the data.
- 📊 Histograms and box plots are graphical tools that represent the distribution of a numeric variable, such as the distribution of heights in a sample.
- 🌟 The normal distribution is a common model for population data, assuming a bell-shaped and symmetric distribution around the mean.
- 🔮 Knowing the true parameters of a population, such as the mean and standard deviation, allows for making predictions about the likelihood of observing certain sample statistics.
- 🤔 Statistical inference involves using sample data to make statements about the population, which is facilitated by understanding the relationship between sample statistics and population parameters.
- 🚀 The concepts discussed lay the groundwork for further statistical analysis, including hypothesis testing and estimation, which are crucial for drawing meaningful conclusions from data.
Q & A
What is the main focus of the video?
-The main focus of the video is to discuss the concepts of samples and populations in statistics and how they are interconnected.
How is a sample from a population of 100 individuals with a particular disease example used in the video?
-The sample is used to illustrate the calculation of a sample proportion (P-hat), which is found to be 0.12 or 12%, representing the individuals with the disease in the sample.
What type of variable is the 'X' variable in the disease example and how is it summarized?
-The 'X' variable in the disease example is categorical, and it is summarized using a sample proportion and a bar plot.
What is the significance of the distribution concept in statistics?
-The distribution concept is significant in statistics as it helps describe the pattern of data points in a sample or population, which is essential for summarizing data and making statistical inferences.
How does the video explain the theoretical probability distribution of a population?
-The video explains the theoretical probability distribution by using the example of a population's true probability of having a disease, which is modeled using a probability distribution, specifically a binomial distribution in this case.
What parameters define the binomial distribution in the video's example?
-The parameters defining the binomial distribution in the example are 'n' trials and 'P' being the probability of success, which is the true probability of having the disease in the population.
How is the height example used to illustrate the concepts of sample mean and standard deviation?
-The height example is used to illustrate how a sample's mean and standard deviation are calculated for a numeric variable like height, and how this data can be summarized graphically using a histogram or a box plot.
What is the assumed true mean and standard deviation for the height in the population in the video's example?
-In the video's example, the assumed true mean height for the population is 175 centimeters, and the true standard deviation is 10 centimeters.
How does the video relate the normal distribution to the population's height distribution?
-The video relates the normal distribution to the population's height distribution by assuming that the heights are approximately normally distributed and symmetrically distributed around the true mean of 175 centimeters.
What is the purpose of understanding the theoretical distributions of a population?
-Understanding the theoretical distributions of a population helps in making statistical inferences from sample data, allowing us to estimate the likelihood of observing certain outcomes in a sample based on the known characteristics of the population.
What is the next topic for discussion following the examples of sample and population distributions?
-The next topic for discussion following the examples is statistical inference, which involves making statements about a population based on the analysis of sample data.
Outlines
🔍 Introduction to Samples and Populations
This paragraph introduces the fundamental concepts of samples and populations in statistics. It begins with an example of a sample taken from a population of 100 individuals, where the variable X represents the presence or absence of a disease. The sample proportion, denoted as P-hat, is calculated to be 0.12 or 12%, indicating that 12 out of 100 individuals in the sample have the disease. The concept of distribution is emphasized, and a bar plot is used to visualize the distribution of the sample data. The paragraph then explores the idea of knowing the entire population's characteristics, such as the true probability of disease, and introduces the theoretical probability distribution. The binomial distribution is mentioned as a model for this scenario, with parameters n (number of trials) and P (probability of success). The goal is to understand how likely certain outcomes are in a sample when the population parameters are known.
📊 Understanding Distributions with Samples and Populations
The second paragraph delves into the analysis of numeric variables, such as height, using sample statistics like mean and standard deviation. It discusses the use of histograms and box plots to graphically summarize data. The paragraph then hypothesizes knowing the true mean and standard deviation of the entire population, suggesting a normal distribution for the variable X (height). The concept of a normal probability distribution is introduced, and the idea of a bell-shaped, symmetric distribution around the mean is explored. The paragraph emphasizes the theoretical understanding of how likely certain sample statistics are to occur, given knowledge of the population parameters, which is crucial for statistical inference. It sets the stage for the next topic: making statements about a population based on sample data.
Mindmap
Keywords
💡Population
💡Sample
💡Sample Proportion
💡Categorical Variable
💡Binomial Distribution
💡Sample Mean
💡Standard Deviation
💡Histogram
💡Normal Distribution
💡Statistical Inference
Highlights
Exploring the concepts of samples and populations in statistics.
Alternating between population and sample ideas in introductory statistics.
Example of taking a sample from a population of 100 individuals to record a disease.
Using a sample proportion (p-hat) to summarize categorical data.
Visualizing sample data with a bar plot to show disease presence.
Understanding the importance of distribution in statistics.
Knowing the true probability of disease within a population and modeling it with a probability distribution.
Describing the population with a theoretical probability distribution.
Binomial distribution as a model for the population's disease probability.
Exploring the concept of a population's true mean and standard deviation.
Summarizing a numeric variable like height with sample mean and standard deviation.
Using histograms or box plots to visualize the distribution of a sample.
Assuming a normal distribution for the population's height variable.
Theoretical understanding of how sample data relates to the population in a normal distribution.
Building the concept of statistical inference from sample data to make statements about a population.
The importance of understanding the likelihood of certain outcomes in sample data.
Transcripts
Browse More Related Video
Statistics Course Overview | Best Statistics Course | MarinStatsLectures
Sample, Statistic, Population, Parameter Part 1

Sampling Distributions: Introduction to the Concept
6.3.0 Sampling Distributions and Estimators - Lesson Overview, Learning Outcomes and Key Concepts
The Central Limit Theorem, Clearly Explained!!!

Elementary Stats Lesson #13
5.0 / 5 (0 votes)
Thanks for rating: