The Central Limit Theorem, Clearly Explained!!!
TLDRIn this StatQuest episode, Josh Starmer explains the Central Limit Theorem (CLT), a fundamental concept in statistics. The CLT states that regardless of the underlying distribution of a population, the distribution of sample means will approximate a normal distribution as the sample size increases. Starmer illustrates this with examples using uniform and exponential distributions, showing how sample means converge to a normal distribution even when the original data does not follow it. He emphasizes the practical implications of the CLT, which allows for the use of normal distribution-based statistical tests like t-tests and ANOVA without needing to know the exact distribution of the data. He also clarifies that while a sample size of 30 is a common rule of thumb for the CLT to apply, smaller sample sizes can also work, as demonstrated in his examples.
Takeaways
- 📚 The Central Limit Theorem (CLT) is a fundamental concept in statistics that is often used in various statistical tests.
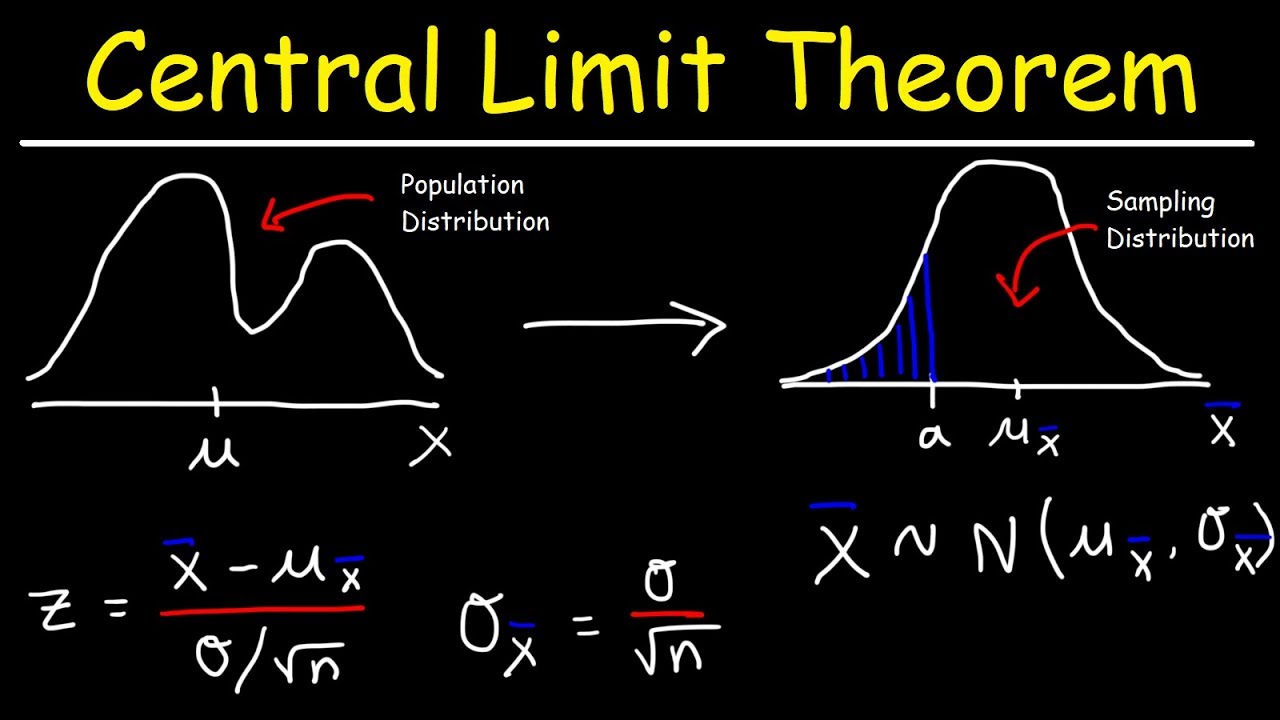
- 📉 The CLT states that the distribution of sample means will approach a normal distribution as the sample size increases, regardless of the original distribution.
- 🔍 Josh Starmer introduces the CLT by explaining it requires familiarity with the normal distribution and the concept of sampling.
- 📊 The video demonstrates the CLT using examples from both a uniform and an exponential distribution, showing how their sample means become normally distributed.
- 🌟 The histogram of sample means becomes more normally distributed as more samples are collected, illustrating the CLT in action.
- 🎯 The practical implication of the CLT is that it allows for statistical inference without knowing the exact distribution of the underlying population.
- 📈 The CLT is crucial for creating confidence intervals, conducting t-tests, and performing ANOVA, which all rely on the normality of sample means.
- 🤔 A common misconception is that a sample size of at least 30 is needed for the CLT to apply, but this is just a rule of thumb and not a strict requirement.
- 🚫 The video mentions that there are rare distributions, like the Cauchy distribution, that do not have a mean and thus cannot be used with the CLT.
- 👍 The presenter encourages viewers to subscribe for more educational content and to support the channel by purchasing original songs.
- 🔬 The video serves as a clear and simple explanation of the CLT, making it accessible to those who may not have a deep background in statistics.
Q & A
What is the Central Limit Theorem (CLT)?
-The Central Limit Theorem is a statistical theory that states that the distribution of sample means approximates a normal distribution as the sample size gets larger, regardless of the original distribution of the population from which the samples are drawn.
Why is the Central Limit Theorem important in statistics?
-The Central Limit Theorem is important because it provides a basis for many statistical tests and allows for the use of normal distribution properties to make inferences about population parameters, even when the population distribution is unknown.
What does the video demonstrate about the uniform distribution and the sample means?
-The video demonstrates that even though the original data comes from a uniform distribution, the means of the samples collected from this distribution will be normally distributed according to the CLT.
Can the Central Limit Theorem be applied to an exponential distribution?
-Yes, the video shows that the Central Limit Theorem can be applied to an exponential distribution, as the means of samples taken from this distribution also become normally distributed.
What is the practical implication of the CLT for statistical testing?
-The practical implication is that we can perform various statistical tests such as t-tests and ANOVA, which rely on the sample mean, without needing to know the exact distribution of the underlying population data.
What is the 'rule of thumb' mentioned in the video regarding sample size for the CLT to hold true?
-The video mentions a rule of thumb that suggests a sample size of at least 30 for the CLT to hold true. However, this is not a strict requirement and is generally considered safe.
What does the video suggest about the minimum sample size for the CLT to be effective?
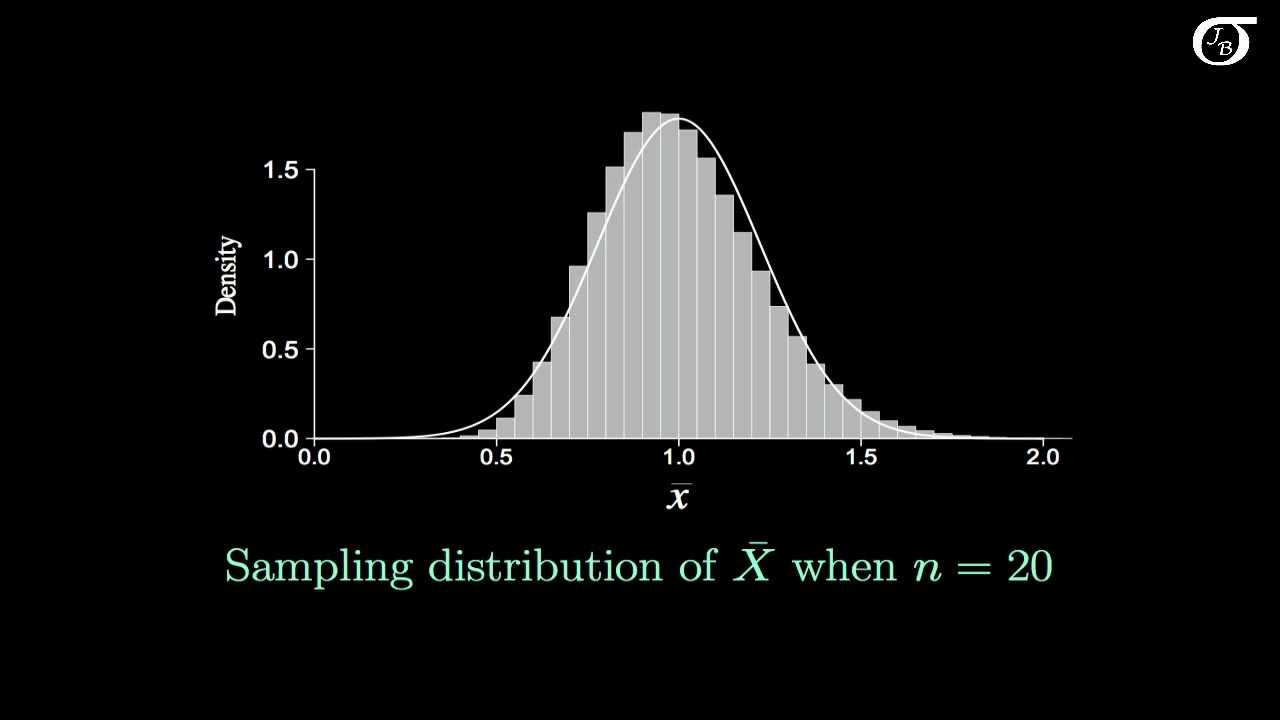
-The video suggests that a sample size of 20 can be effective for the CLT, as demonstrated with the examples, and challenges the rule of thumb that requires a minimum sample size of 30.
What is the 'fine print' mentioned in the video regarding the CLT?
-The 'fine print' mentioned in the video refers to the condition that for the CLT to work, you must be able to calculate a mean from your sample. There are very few distributions, like the Cauchy distribution, that do not have a mean.
What does the video suggest about the commonality of distributions without means?
-The video suggests that distributions without means, such as the Cauchy distribution, are rare in practical applications and the speaker has not encountered them in 20 years of biostatistics.
What does the video recommend for those interested in learning more about the normal distribution and sampling?
-The video recommends watching other StatQuest episodes titled 'Normal Distribution Clearly Explained' and 'Sampling from a Statistical Distribution Clearly Explained' for those who are not already familiar with these concepts.
Outlines
📚 Introduction to the Central Limit Theorem
Josh Starmer introduces the Central Limit Theorem (CLT), a fundamental concept in statistics, which he aims to explain clearly in this StatQuest episode. He suggests that viewers should be familiar with the normal distribution and the concept of sampling from a statistical distribution to better understand the CLT. The episode begins with an example using a uniform distribution to demonstrate how the mean of many samples tends to form a normal distribution, even when the original data does not follow a normal distribution. Starmer emphasizes the simplicity of the CLT and its importance in various statistical applications.
🔍 Practical Implications and Fine Print of the CLT
This paragraph delves into the practical implications of the Central Limit Theorem. It explains that even though we may not know the distribution of our data in an experiment, the CLT assures us that the sample means will be normally distributed. This allows us to perform statistical tests such as confidence intervals, t-tests, and ANOVA without worrying about the original data distribution. The video also addresses a common misconception that a sample size of at least 30 is required for the CLT to hold, clarifying that this is a rule of thumb and not a strict requirement, as demonstrated with examples using a sample size of 20. The fine print is mentioned, indicating that there are some exceptions and conditions under which the CLT applies, such as the ability to calculate a mean from the sample. The video concludes with an invitation for viewers to subscribe for more content and to support the channel by purchasing original songs.
Mindmap
Keywords
💡Central Limit Theorem
💡Normal Distribution
💡Uniform Distribution
💡Exponential Distribution
💡Sampling
💡Mean
💡Histogram
💡Confidence Intervals
💡T-tests
💡ANOVA
💡Sample Size
Highlights
The Central Limit Theorem (CLT) is the basis for a lot of statistics and is a simple concept.
Understanding the CLT is made easier through examples, starting with a uniform distribution.
Uniform distribution has equal probabilities of selecting values between 0 and 1.
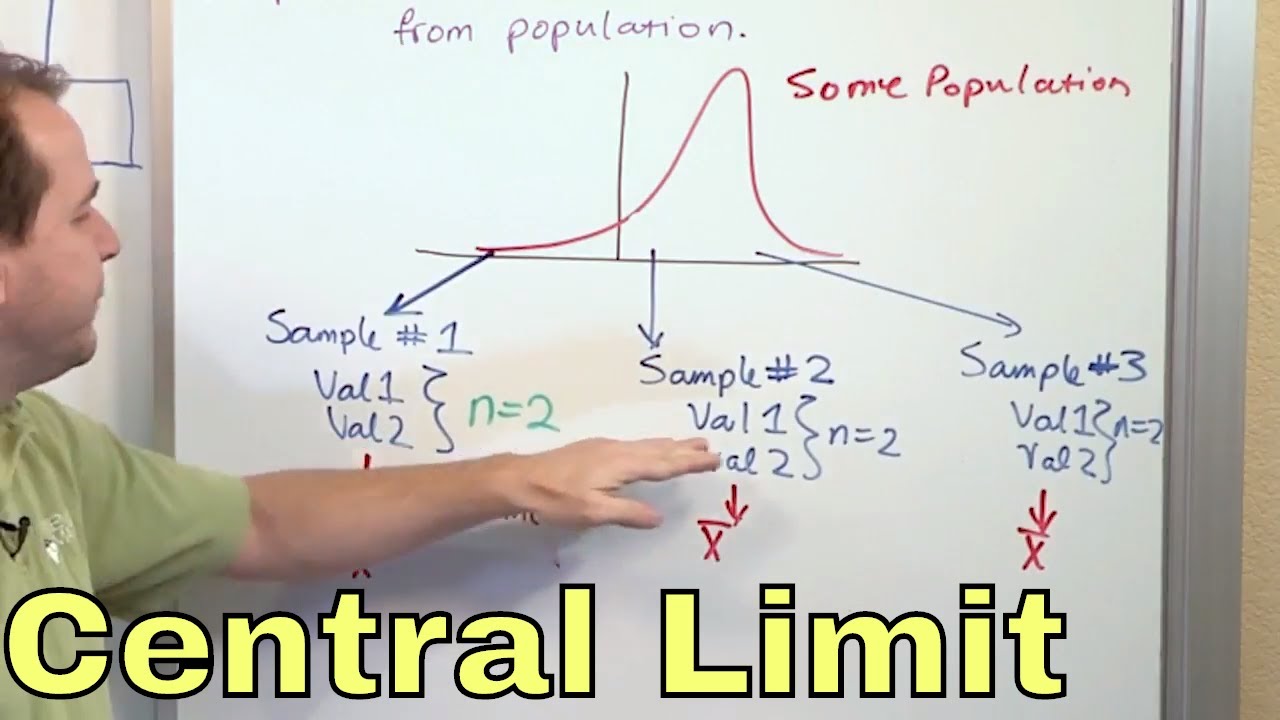
Collecting random samples and calculating their mean from a uniform distribution.
Histogram of mean values starts to show a pattern with an increasing number of samples.
Means calculated from a uniform distribution are normally distributed, as shown by the histogram and normal distribution overlay.
The CLT states that means are normally distributed, regardless of the original distribution of the data.
An exponential distribution example demonstrates the CLT with means also becoming normally distributed.
The practical implication of the CLT is that it allows for statistical tests without knowing the original data distribution.
Sample means can be used for confidence intervals, t-tests, and ANOVA due to their normal distribution.
A common misconception is that the CLT requires a sample size of at least 30, but this is just a rule of thumb.
The CLT works with any distribution from which a mean can be calculated, with rare exceptions.
The Koshi distribution is an exception that doesn't have a sample mean.
The video encourages viewers to share if they know of other distributions without means in the comments.
The video concludes by emphasizing the importance and practicality of the CLT in statistical analysis.
The presenter invites viewers to subscribe for more StatQuest videos and support the channel.
Transcripts
Browse More Related Video
6.4.1 The Central Limit Theorem - What the Central Limit Theorem Says and What It Doesn't Say
02 - What is the Central Limit Theorem in Statistics? - Part 1
Introduction to the Central Limit Theorem

Elementary Stats Lesson #13
Central Limit Theorem - Sampling Distribution of Sample Means - Stats & Probability
6.4.2 The Central Limit Theorem - Probabilities for a Range of Normally Distributed Sample Means
5.0 / 5 (0 votes)
Thanks for rating: