Statistics Course Overview | Best Statistics Course | MarinStatsLectures
TLDRThe video script offers an insightful overview of an introductory statistics course, highlighting the core concepts of studying populations and samples. It outlines the progression from collecting and summarizing data, understanding probability theory, and exploring the sampling distribution, to the pivotal realm of statistical inference. The course delves into various statistical methods for analyzing numeric and categorical data, including confidence intervals, hypothesis testing, and regression analysis, ultimately aiming to make informed statements about populations based on sample data.
Takeaways
- 📊 Intro to Stats: The course aims to provide a comprehensive overview of introductory statistics, focusing on the study of populations and samples.
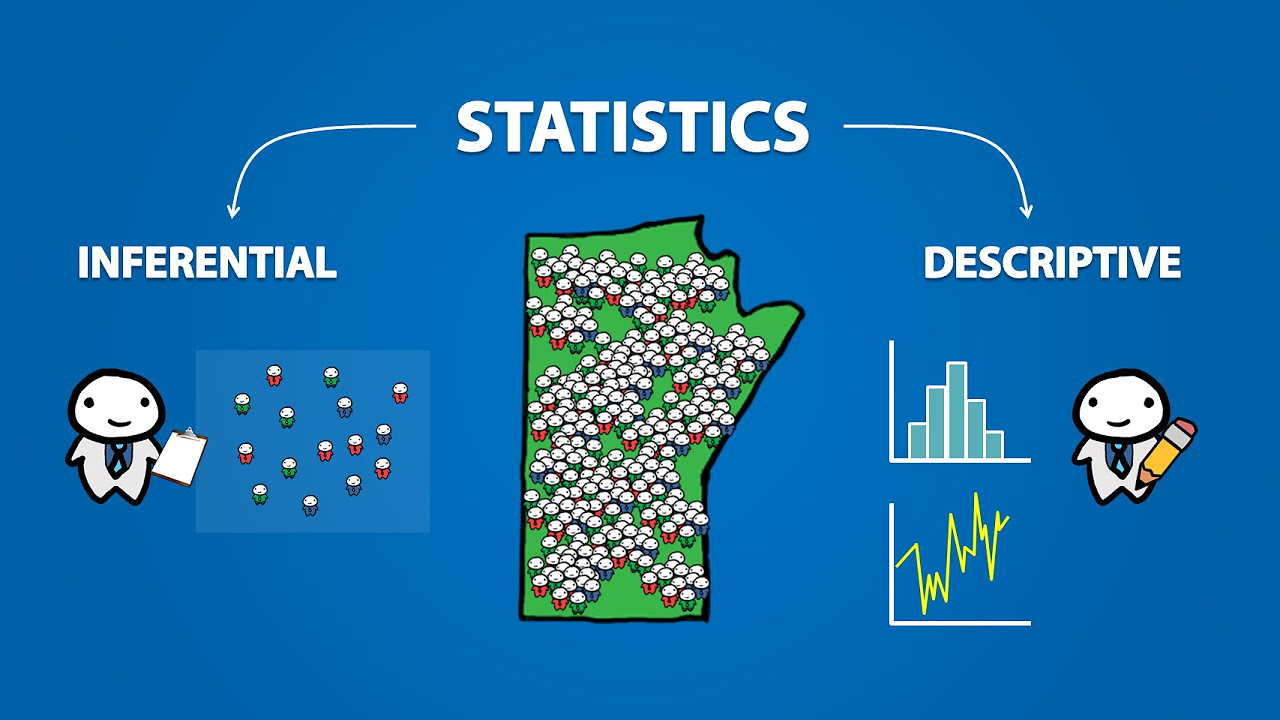
- 🔍 Population vs. Sample: Statistical science often involves studying a population that is too large to examine in its entirety, hence the reliance on samples to make inferences.
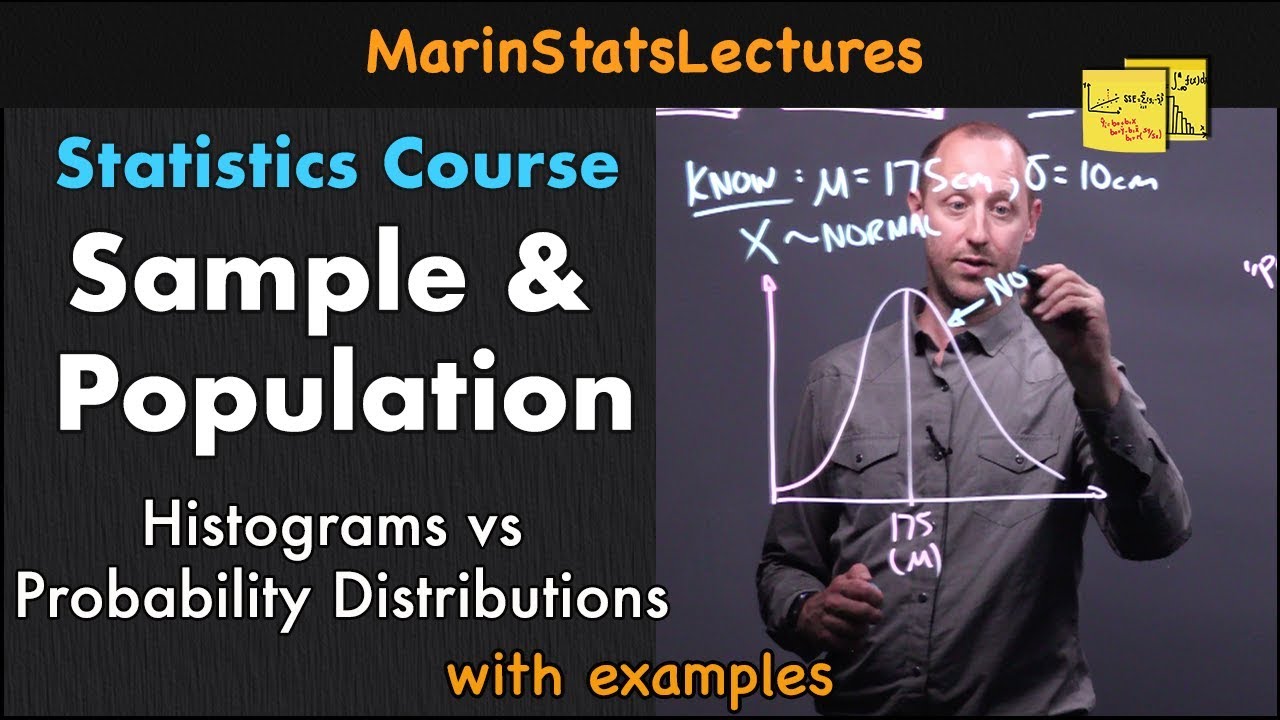
- 📈 Estimating Population Parameters: The sample mean (mu hat or x-bar) is used as the best estimate for the population mean, which is a central concept in statistics.
- 📚 Module One: Covers data collection and summarization, including different sampling techniques and graphical and numeric summaries.
- 🎯 Probability Theory: Module Two delves into understanding how samples behave if the truth about the entire population is known, including probability rules and distributions.
- 🔎 Statistical Inference: Module Three introduces the core of statistics, which involves using sample data to make inferences about the population parameters.
- 🔑 Confidence Intervals, Hypothesis Tests, and P-values: These are key tools for making statements about the population based on sample data.
- 🔍 Bivariate Analysis: Module Four lays the foundation for analyzing the relationship between two variables, distinguishing between parametric and nonparametric methods.
- 📊 Analyzing Categorical and Numeric Variables: Modules Five to Seven focus on the effects of categorical (X) and numeric (X) variables on numeric (Y) and categorical (Y) variables, using methods like t-tests, ANOVA, chi-square tests, and regression.
- 🌟 Multiple Regression: Module Eight introduces the concept of adjusting for other variables when analyzing the effect of a variable on an outcome, setting the stage for more advanced statistical methods.
- 🎓 Course Structure: The course is structured around eight modules, each building on the previous to provide a solid foundation in statistical concepts and their applications.
Q & A
What is the primary focus of statistical sciences?
-The primary focus of statistical sciences is to study populations, often too large to study in their entirety, by taking samples and using them to make inferences about the population.
Why is it necessary to use samples instead of studying the entire population?
-It is necessary to use samples because populations are often too large to study completely, and sampling allows for more practical and efficient analysis while still providing accurate insights about the population.
What are some common sampling techniques mentioned in the script?
-Common sampling techniques include simple random samples, stratified samples, and different study designs such as observational studies (cross-sectional studies, cohorts, or case-controls) and experimental studies.
How are data summarized in statistical analysis?
-Data are summarized both graphically, using plots like box plots, histograms, and scatter plots, and numerically, using descriptive statistics or summary statistics such as the sample mean, sample median, and standard deviation.
What is probability theory and how does it relate to statistical analysis?
-Probability theory is the study of the likelihood of various outcomes when collecting sample data, given the true state of the entire population. It helps understand what sorts of sample statistics are likely to occur and lays the foundation for statistical inference.
What is the concept of a sampling distribution?
-A sampling distribution is the probability distribution of a sample statistic, such as the sample mean, when multiple samples of the same size are drawn from the same population. It helps in understanding how samples behave and how they can be used to estimate population parameters.
What does statistical inference involve?
-Statistical inference involves using sample data to make statements about the population parameters. It includes methods like confidence intervals, hypothesis tests, and p-values to estimate and test population characteristics based on sample data.
What are the main topics covered in the first three modules of the course?
-The first module covers collecting and summarizing a sample, the second module discusses probability theory, and the third module introduces the foundations of statistical inference, focusing on estimating a single mean from a numeric variable.
How does the course approach the analysis of the relationship between two variables?
-The course approaches the analysis of the relationship between two variables by first laying the foundation for bivariate or two-variable analysis in module four, and then covering specific methods for analyzing the effect of categorical or numeric variables on another variable in modules five to seven.
What is the purpose of module number eight in the course?
-Module number eight lays the foundation for adjusting the analysis of the effect of a variable on another by accounting for other variables. It introduces methods like multiple regression to estimate the effect of one variable on another while controlling for the influence of additional variables.
What are some examples of variables that might need to be accounted for in observational data analysis?
-In observational data analysis, variables such as job types, socioeconomic status, or lifestyle factors might need to be accounted for because they can be related to both the independent variable (like smoking) and the dependent variable (like lung cancer risk), potentially affecting the observed relationship.
Outlines
📊 Introduction to Intro Stats and Sampling Techniques
This paragraph introduces the fundamental concepts of introductory statistics courses, focusing on studying populations and utilizing samples to make inferences. It explains that while populations are often too large to study entirely, samples can be taken and used to make statements about the population. The introduction of key statistical ideas such as the mean of the population and the use of sample mean (mu hat or x-bar) as an estimate is discussed. The paragraph outlines the course modules, starting with collecting and summarizing data, discussing sampling techniques like simple random samples and stratified samples, and different study designs including observational and experimental settings. It emphasizes the importance of graphical and numeric summaries, such as box plots, histograms, and descriptive statistics.
🎯 Probability Theory and Understanding Sample Behavior
The second paragraph delves into probability theory, which is the study of how samples behave if we know the truth about the entire population. It covers the basics of probability rules, such as the likelihood of events occurring, and introduces the concept of probability distributions, including the normal distribution and others like the binomial, Poisson, and exponential distributions. The paragraph explains that this section helps understand what sample outcomes are likely when data is collected, which is essential for grasping the concept of a sampling distribution. This knowledge is a precursor to statistical inference, which is the process of making statements about a population based on sample data, a topic that will be covered in more detail in the third module of the course.
🔍 Exploring Statistical Inference and Data Analysis
The third paragraph discusses statistical inference, the process of drawing conclusions about a population based on sample data. It outlines the progression of the course, moving from understanding the behavior of samples to making generalizations about populations. The paragraph covers various forms of confidence intervals, hypothesis tests, and p-values, which are statistical tools used to make these generalizations. It also touches on the distinction between parametric and nonparametric approaches, and introduces the concept of analyzing data with numeric or categorical variables. The paragraph concludes by providing an overview of the eight modules of the course, each focusing on different aspects of statistical analysis, from summarizing data to analyzing the effects of variables on outcomes, and adjusting for other variables in the analysis.
Mindmap
Keywords
💡population
💡sample
💡mean
💡standard deviation
💡probability theory
💡sampling distribution
💡statistical inference
💡confidence interval
💡hypothesis test
💡p-value
💡bivariate analysis
💡regression
Highlights
The introduction of statistical sciences and their focus on studying populations through samples due to the large size of populations.
The use of sample statistics, such as the sample mean (mu hat or x-bar), as the best estimate for the population mean.
The structure of an intro stats course, which revolves around the concepts of populations and samples.
Module one focuses on collecting and summarizing sample data, discussing various sampling techniques and study designs.
Graphical and numeric summaries of data, including box plots, histograms, scatter plots, sample mean, median, standard deviation, and correlation.
Module two delves into probability theory, exploring the likelihood of certain outcomes when sampling from a known population.
Discussion of probability distributions such as the normal, binomial, Poisson, and exponential distributions.
The concept of a sampling distribution and its importance in understanding sample behavior.
Module three introduces statistical inference, the process of making statements about a population based on sample data.
Exploration of confidence intervals, hypothesis tests, and p-values as tools for statistical inference.
The distinction between parametric and nonparametric approaches in statistical analysis.
Module four lays the foundation for bivariate or two-variable analysis and the concepts of categorical and numeric variables.
Analyzing the effect of a categorical variable on a numeric variable, covered in module five.
Module six covers the analysis of the relationship between two categorical variables, including the chi-square test and Fisher's test.
Module seven discusses the effect of a numeric variable on another numeric variable, including correlation and simple linear regression.
Module eight introduces the analysis of the effect of one variable on another, adjusted for other variables, using multiple regression methods.
The course's progression through different forms of confidence intervals and hypothesis tests depending on the type of data.
The importance of understanding the behavior of samples and populations in statistical analysis.
Transcripts
Browse More Related Video
Sample and Population in Statistics | Statistics Tutorial | MarinStatsLectures
Introduction to Statistics (1.1)

Chapter 1 - An Intro to Business Statistics

Is AP Statistics Right For You? An Overview of AP Statistics (in 10 minutes)
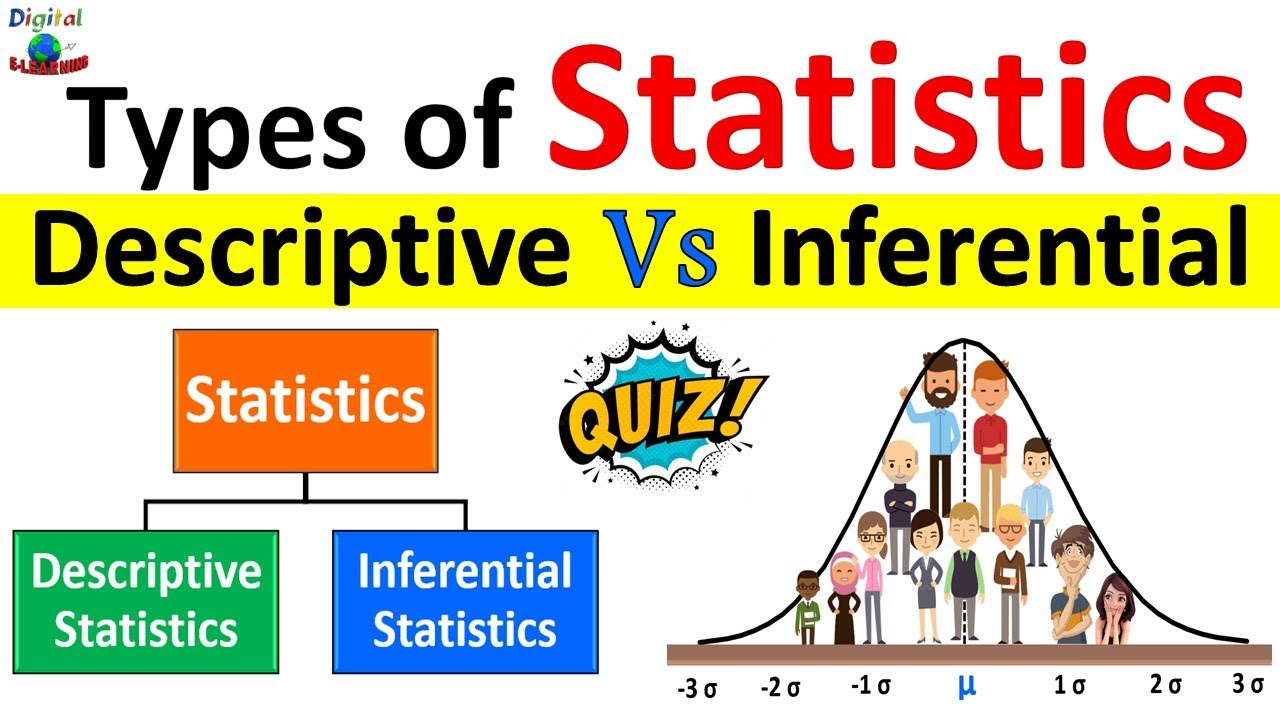
Descriptive Statistics vs Inferential Statistics | Measure of Central Tendency | Types of Statistics

Math 119 Chapter 3 intro
5.0 / 5 (0 votes)
Thanks for rating: