Q Center: a Math tutoring session
TLDRThe video script discusses the process of graphing a polynomial function, focusing on identifying key features such as the horizontal and vertical asymptotes, x-intercept, y-intercept, and holes. The function given is simplified to recognize a hole at x=-1 and a vertical asymptote at x=-4. The horizontal asymptote is determined by analyzing the behavior for large x values, concluding it approaches a height of 1. The x-intercept is found at x=4, and the y-intercept at y=-1. The final graph is described with these points and asymptotic lines, providing a comprehensive understanding of the function's behavior.
Takeaways
- 📈 The task involves graphing a function, including identifying its horizontal and vertical asymptotes, x-intercept, y-intercept, and holes.
- 🤔 The first step is to simplify the given polynomial function by factoring the top and bottom where possible.
- 🔍 A hole in the function is identified at x = -1, where the function is undefined due to a factor of (x + 1) in both numerator and denominator.
- 📊 The vertical asymptote is found by setting the denominator equal to zero, resulting in x = -4 for this function.
- 🎯 To find the horizontal asymptote, consider the behavior of the function as x approaches infinity or negative infinity. Here, the function approaches y = 1 as x goes to infinity.
- 📌 The x-intercept is found by setting the function equal to zero and solving for x, yielding x = 4 for this problem.
- 🔽 The y-intercept is determined by plugging x = 0 into the function, resulting in y = -1.
- 📈 The graph of the function will have a vertical asymptote at x = -4, approach a height of 1 as x goes to infinity, and will not cross the x-axis.
- 🚀 The function will shoot off to positive infinity and then approach the horizontal asymptote as it extends to the right on the graph.
- 📝 The final graph will include all these elements: a hole at x = -1, vertical asymptote at x = -4, x-intercept at x = 4, y-intercept at y = -1, and a horizontal asymptote approaching y = 1.
Q & A
What is the first step in simplifying the given function?
-The first step is to factor the numerator and the denominator, separating the terms to identify common factors.
What does the presence of 'x plus one' in both the numerator and the denominator indicate?
-It indicates that there is a hole at x equals negative one in the function's graph.
How is the vertical asymptote determined?
-The vertical asymptote is determined where the denominator of the function equals zero, which in this case is at x equals negative four.
What happens when you set the function equal to zero to find the x-intercept?
-Setting the function equal to zero gives us the equation x equals four, which is the x-intercept of the function.
How do you find the y-intercept of the function?
-The y-intercept is found by substituting x equals zero into the function, which results in y equals negative one.
How does the horizontal asymptote relate to the behavior of the function as x approaches infinity?
-The horizontal asymptote represents the limit the function approaches as x becomes very large or very small, which in this case is y equals one.
What is the significance of the horizontal asymptote in the graph of the function?
-The horizontal asymptote indicates the value the function approaches as x moves towards positive or negative infinity, which helps in understanding the long-term behavior of the function.
Why can't the function cross the x-axis when there is a vertical asymptote?
-The function cannot cross the x-axis because the vertical asymptote indicates a point where the function approaches positive or negative infinity, not where it would intersect the x-axis.
How does the process of simplifying the function help in graphing it?
-Simplifying the function helps in identifying key features such as holes, vertical and horizontal asymptotes, and intercepts, which are essential for accurately graphing the function.
What is the role of the coefficients in determining the horizontal asymptote?
-The coefficients of the highest power of x in the numerator and the denominator are used to determine the slope of the horizontal asymptote when these powers are equal.
Outlines
📊 Graphing a Polynomial Function
The speaker discusses the process of graphing a polynomial function, including identifying and plotting key features such as the horizontal and vertical asymptotes, x-intercept, y-intercept, and holes. They begin by simplifying the given function, which is a rational expression with x terms in the numerator and denominator. The speaker identifies a hole at x = -1 due to the common factor in the numerator and denominator. They then determine the vertical asymptote by setting the denominator to zero, finding it at x = -4. To find the horizontal asymptote, they consider the behavior of the function as x approaches infinity and conclude it approaches y = 1. The x-intercept is found at x = 4 by setting the function equal to zero, and the y-intercept is calculated by substituting x = 0 into the equation, resulting in y = -1. The speaker describes the shape of the graph, including how it approaches the vertical asymptote and the horizontal asymptote as x moves towards positive and negative infinity.
🎯 Completing the Graph and Visualizing Asymptotic Behavior
The speaker continues the discussion on graphing the polynomial function, focusing on the completion of the graph and the asymptotic behavior. They explain that the graph cannot cross the x-axis due to the vertical asymptote at x = -4 and must approach it without crossing. The speaker describes how the graph will shoot off to positive infinity and then descend, approaching the horizontal asymptote with a value of 1. The summary emphasizes the final shape of the graph, with its vertical asymptote, x-intercept, and the approach to both horizontal and vertical asymptotes as x values extend to the limits.
Mindmap
Keywords
💡Simplify
💡Polynomial
💡Factor
💡Hole
💡Vertical Asymptote
💡Horizontal Asymptote
💡X-intercept
💡Y-intercept
💡Limit
💡Graph
💡Infinity
Highlights
The problem involves graphing a function with specific asymptotes and holes.
The function is in polynomial form, allowing for simplification.
The first step is to factor the polynomial to identify common factors.
A hole is identified at x equals negative one.
The vertical asymptote is found by setting the denominator equal to zero, resulting in x equals negative four.
The horizontal asymptote is determined by the behavior of the function as x approaches infinity, which is found to be y equals one.
The x-intercept is found by setting the function equal to zero, resulting in x equals four.
The y-intercept is found by plugging x equals zero into the equation, resulting in y equals negative one.
The graph of the function will approach the horizontal asymptote as x goes to positive or negative infinity.
The graph will have a vertical asymptote at x equals negative four, as identified earlier.
The graph passes through the point (4, 0) due to the x-intercept.
The function cannot cross the x-axis due to the nature of the asymptotes and holes.
The graph will shoot off to positive infinity and then approach the horizontal asymptote.
The process described provides a comprehensive method for graphing complex functions.
This approach is useful for understanding the behavior of functions with asymptotes and holes.
The method can be applied to a variety of polynomial functions to determine their graphical characteristics.
Transcripts
Browse More Related Video
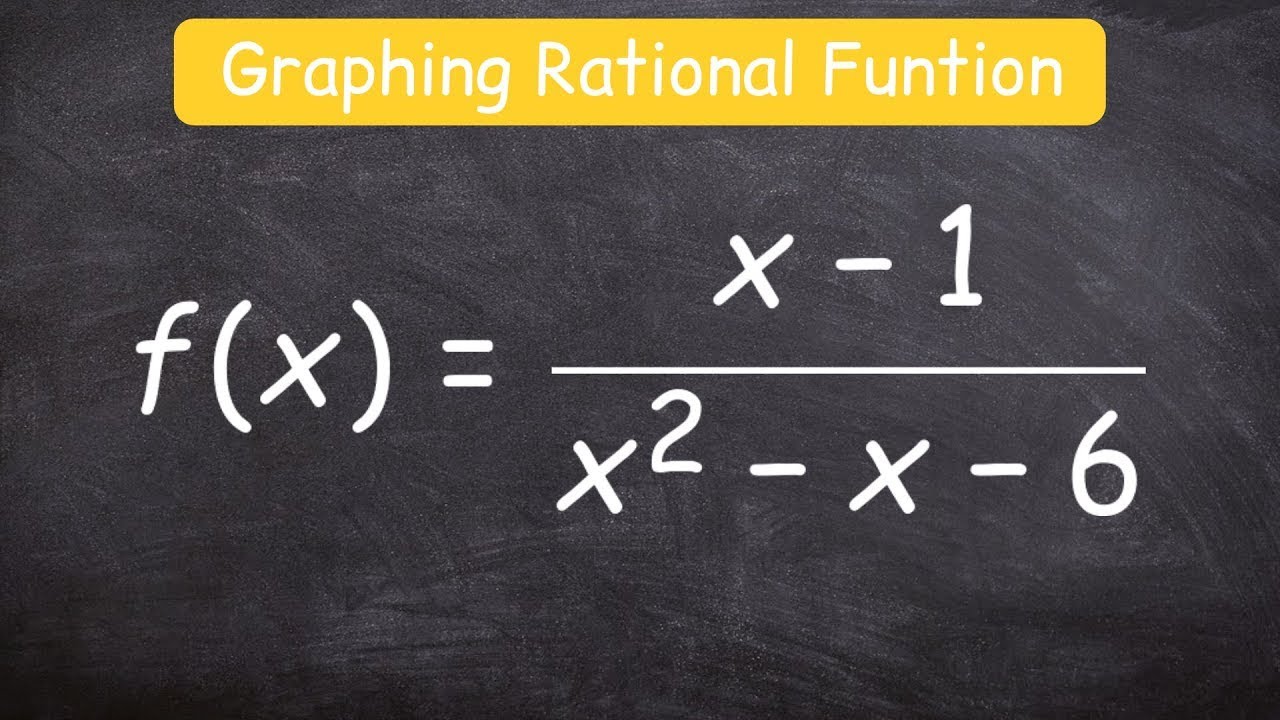
How to graph a rational function using 6 steps
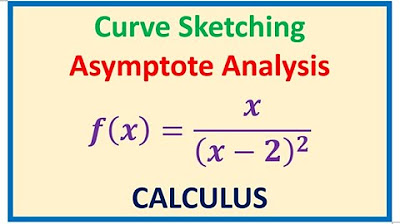
Curve Sketching with Asymptotes x/(x - 2)^2 and Derivatives of Rational Function

Infinite Limit vs Limits at Infinity of a Composite Function

AP Precalculus Practice Exam Question 21
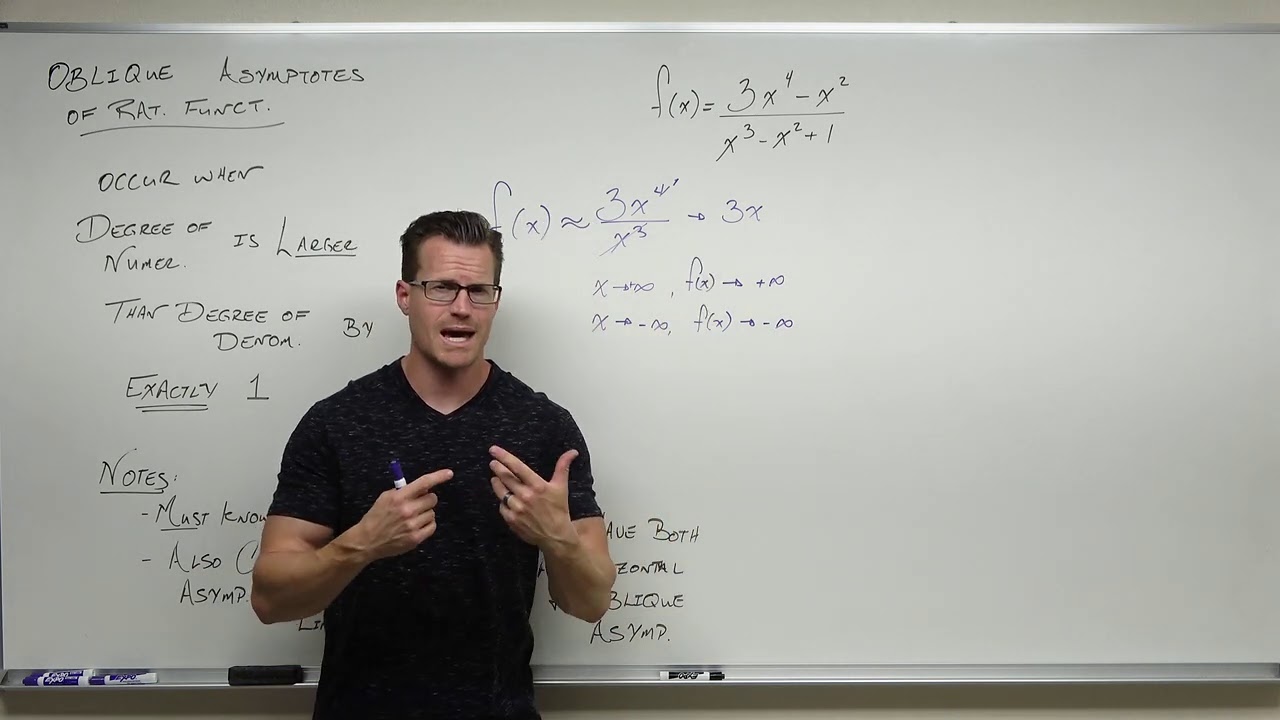
Finding an Oblique Asymptote of a Rational Function (Precalculus - College Algebra 41)
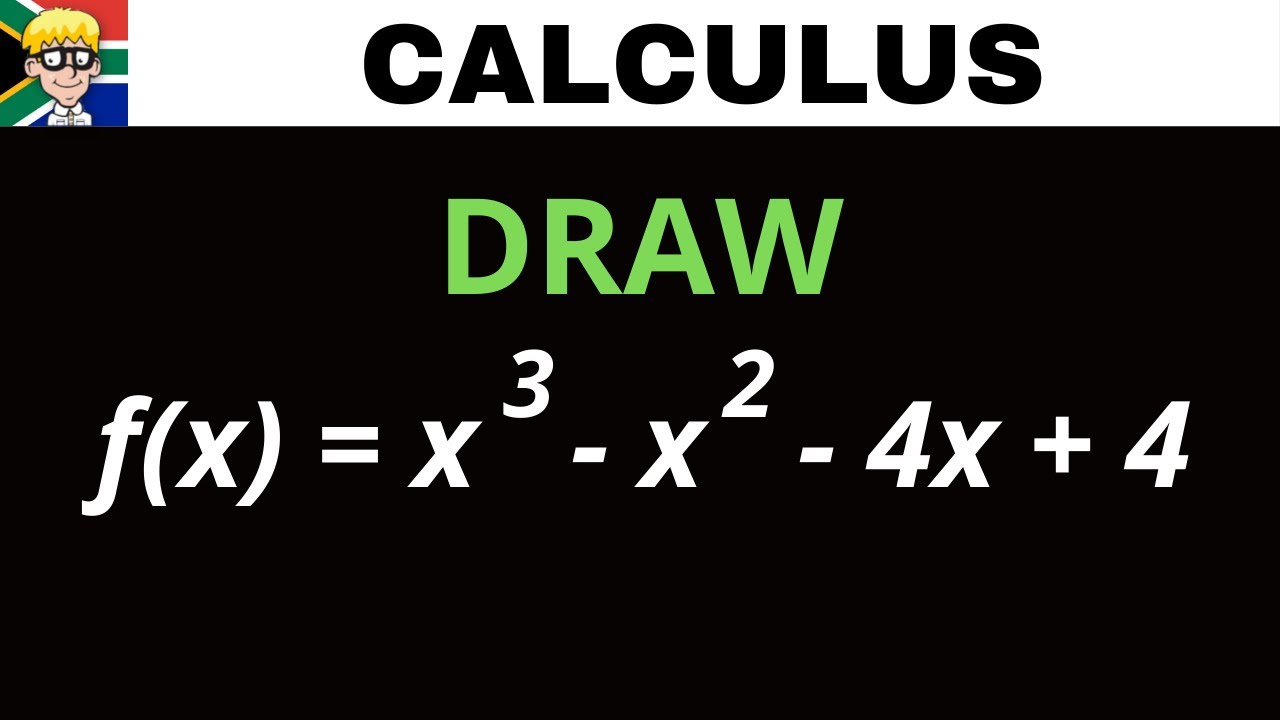
Draw Cubic Graph Grade 12
5.0 / 5 (0 votes)
Thanks for rating: