How to graph a rational function using 6 steps
TLDRThe video script is a comprehensive guide on understanding and graphing rational functions, focusing on vertical and horizontal asymptotes, x and y-intercepts, and symmetry. The instructor explains how to find vertical asymptotes by setting the denominator to zero and factoring, resulting in asymptotes at x = 3 and x = -2, represented with dashed lines. For horizontal asymptotes, the degrees of the numerator and denominator are compared, revealing a horizontal asymptote at y = 0. The x-intercept is found by setting f(x) to zero and solving for x, yielding x = 1. The y-intercept is calculated by substituting x = 0 into the function, resulting in y = 1/6. The script also discusses the absence of slant asymptotes and the process of determining symmetry by evaluating f(-x). Finally, the instructor guides through plotting points to visualize the graph, emphasizing the importance of understanding the behavior of rational functions and the role of asymptotes in their representation.
Takeaways
- 📚 To find vertical asymptotes, set the denominator of a rational function to zero and solve for x.
- 📈 Vertical asymptotes are represented on the graph with dashed lines and indicate values where the function is undefined.
- 🔍 For horizontal asymptotes, compare the degrees of the numerator and denominator to determine the asymptote's equation.
- ✂️ The function's domain excludes values that make the denominator zero, which are the vertical asymptotes.
- 🔢 To find the x-intercept, set the function equal to zero and solve for x, ensuring to eliminate the variable from the denominator first.
- 📉 The y-intercept is found by setting x to zero in the function and solving for the function's value.
- 🔄 Slant (oblique) asymptotes are not present in this particular function, as it does not have a degree of the numerator higher than the denominator.
- 📊 Symmetry can be determined by evaluating the function at negative x and comparing it to the original function; no symmetry was found in this case.
- 📝 To graph the function, plot points by substituting various x-values into the function and finding corresponding f(x) values.
- 🛠️ Using a graphing calculator can simplify the process of finding function values and plotting points, making it easier to visualize the graph.
- 📉 The function's behavior near vertical asymptotes and horizontal asymptotes is crucial for understanding how the graph approaches these lines without crossing them.
Q & A
What is the method to find vertical asymptotes of a function?
-To find vertical asymptotes, set the denominator of the function equal to zero, factor it if necessary, and solve for x. The values of x that make the denominator zero are the vertical asymptotes.
Why are vertical asymptotes not part of the graph of a function?
-Vertical asymptotes are not part of the graph because they correspond to values that are not in the domain of the function, as they make the denominator equal to zero.
How should vertical asymptotes be represented on a graph?
-Vertical asymptotes should be represented on a graph with a dashed line to indicate that the graph does not cross these lines.
How do you determine the horizontal asymptote of a rational function?
-To determine the horizontal asymptote, compare the degrees of the numerator and the denominator. If the degree of the numerator is less than the degree of the denominator, the horizontal asymptote is y = 0.
What is the significance of the horizontal asymptote in the context of a graph?
-The horizontal asymptote represents the value that the graph of a function approaches as x goes to positive or negative infinity. It is possible for the graph to cross a horizontal asymptote, unlike vertical asymptotes which restrict the domain.
How can you find the x-intercept of a function?
-To find the x-intercept, set the function equal to zero (replace f(x) with 0) and solve for x. This will give you the x-coordinate where the graph crosses the x-axis.
What is the process to find the y-intercept of a function?
-To find the y-intercept, set x equal to zero in the function (replace x with 0) and solve for f(x). This will give you the y-coordinate where the graph crosses the y-axis.
Why is it important to consider symmetry when graphing functions?
-Considering symmetry helps in understanding the behavior of the function and can simplify the graphing process. If a function is even, it is symmetric about the y-axis, and if it is odd, it is symmetric about the origin.
How can you determine if a function has symmetry about the y-axis or the origin?
-To determine symmetry, replace f(x) with f(-x) and simplify. If the simplified expression is the same as the original function, it has symmetry about the y-axis. If it is the negative of the original function, it has symmetry about the origin.
What is a practical approach to graphing a function without a calculator?
-A practical approach is to create a table of values by picking several x-values, calculating the corresponding f(x) values, and then plotting these points on a graph to visualize the shape of the function.
Why is it beneficial to use a graphing calculator when graphing functions?
-A graphing calculator can quickly generate a table of values and plot them, providing a visual representation of the function without the need for manual calculations and plot points, saving time and reducing the chance of errors.
Outlines
📚 Understanding Asymptotes and Intercepts
The script begins with an explanation of vertical asymptotes, instructing the audience to set the denominator of a function equal to zero to find them. The example given involves factoring and solving for x, resulting in asymptotes at x = 3 and x = -2, which are represented with dashed lines on the graph. The concept of domain is also discussed, clarifying that the values making the denominator zero are not included in the domain, hence not crossing the asymptotes. The script then moves on to horizontal asymptotes, explaining their determination by comparing the degrees of the numerator and the denominator. In this case, since the degree of the numerator is less than the degree of the denominator, a horizontal asymptote at y = 0 is identified. The process of finding x and y-intercepts is also detailed, with the x-intercept found by setting the function equal to zero and solving for x, yielding x = 1. The y-intercept is found by substituting x = 0 into the function, resulting in a y-intercept at 1/6. The absence of slant asymptotes in this function is noted, and the importance of understanding asymptotes as values the graph approaches is emphasized.
📈 Graphing Functions and Analyzing Symmetry
This paragraph continues the mathematical discussion by addressing the graphing of functions, focusing on the concept of symmetry. The function f(-x) is evaluated to check for y-axis symmetry, but it is determined that the function does not exhibit symmetry since f(-x) does not simplify to the same or opposite form as the original function. The script then emphasizes the importance of plotting points to understand the graph's shape, suggesting the use of a calculator or table function for efficiency. Specific x-values are evaluated to demonstrate how to find corresponding f(x) values, which are then used to plot points on the graph. The instructor also corrects a mistake made during the explanation, reinforcing the importance of accuracy in mathematical processes. The paragraph concludes with a brief mention of even functions and the advantage they offer in graphing by allowing for mirroring the graph across the y-axis.
📊 Final Graph Analysis and Student Interaction
The final paragraph of the script involves the instructor plotting additional points on the graph to demonstrate its shape and confirming the values of the function at specific x-values. There is an interactive element where a student corrects the instructor, highlighting the collaborative nature of the learning process. The instructor acknowledges the correction and proceeds to plot the points, which helps visualize the graph's behavior. The paragraph concludes with a brief interaction with a student named Zach, ensuring understanding and engagement in the lesson.
Mindmap
Keywords
💡Vertical Asymptotes
💡Domain
💡Horizontal Asymptote
💡X-intercept
💡Y-intercept
💡Slant Asymptotes
💡Symmetry
💡Table of Values
💡Graphing
💡Rational Functions
Highlights
Introduction to vertical asymptotes and the process of finding them by setting the denominator equal to zero.
Explanation of how to factor the denominator to find vertical asymptotes at x = 3 and x = -2.
Clarification that vertical asymptotes are not part of the graph but are represented with dashed lines.
Guidance on determining the horizontal asymptote by comparing the degrees of the numerator and denominator.
Rule for horizontal asymptote when the degree of the numerator is less than the degree of the denominator, resulting in y = 0.
Process of finding x-intercepts by setting the function equal to zero and solving for x.
Method to eliminate the variable from the denominator when finding x-intercepts.
Identification of the x-intercept at x = 1.
Absence of slant asymptotes in the given function.
Technique to find the y-intercept by substituting x = 0 into the function and solving.
Calculation of the y-intercept at 1/6.
Difference between vertical and horizontal asymptotes in terms of crossing and domain restrictions.
Importance of understanding asymptotes as what the graph approaches.
Explanation of symmetry in functions and how to test for it by substituting f(-x).
Determination of the lack of symmetry in the given function, neither even nor odd.
Importance of plotting points to understand the graph's shape and the utility of a graphing calculator.
Example of evaluating the function at various points to plot the graph.
Correction of a mistake during the plotting of points, emphasizing the importance of accuracy.
Transcripts
Browse More Related Video
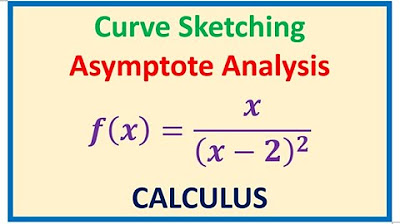
Curve Sketching with Asymptotes x/(x - 2)^2 and Derivatives of Rational Function

Q Center: a Math tutoring session
Finding the Slant Asymptote
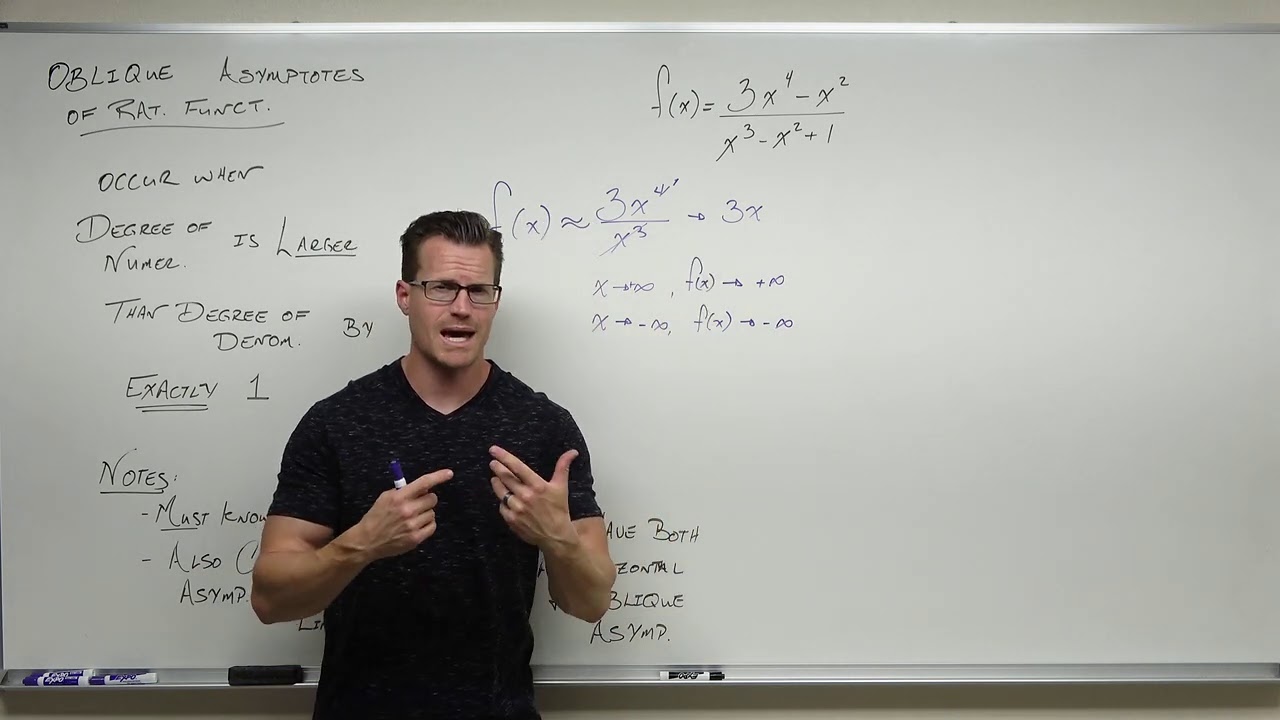
Finding an Oblique Asymptote of a Rational Function (Precalculus - College Algebra 41)
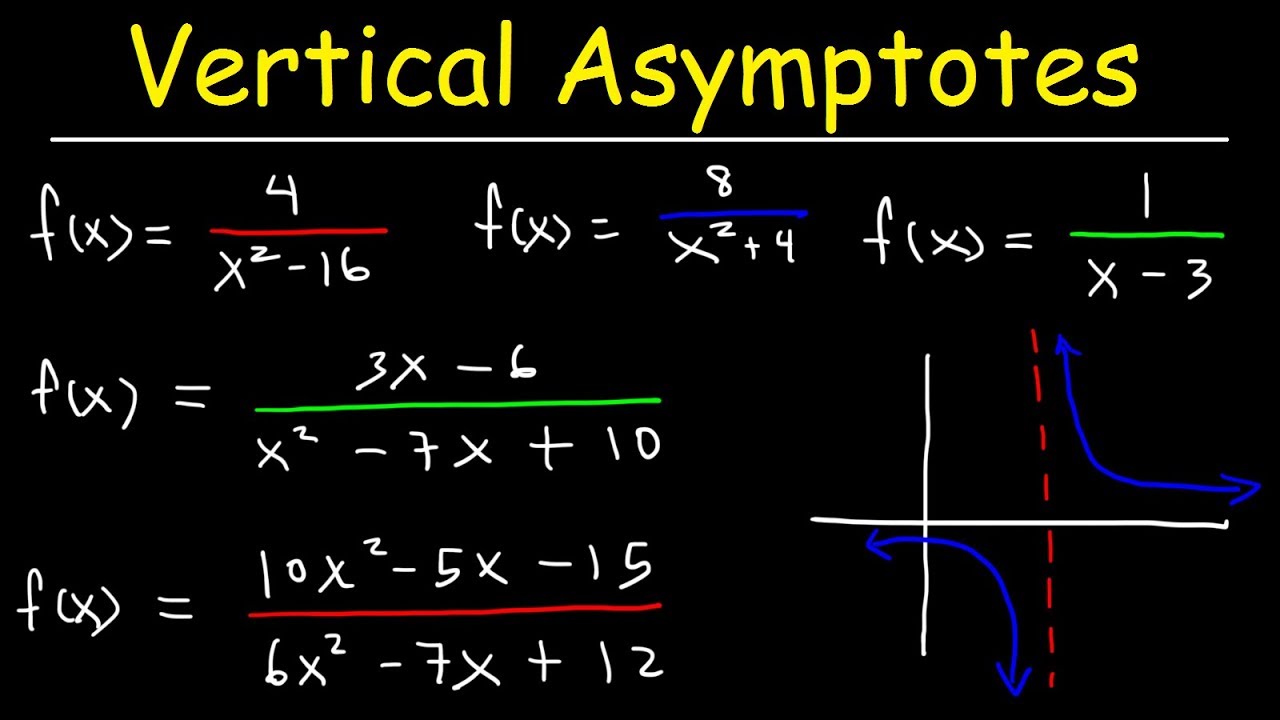
How To Find The Vertical Asymptote of a Function

Graphing Rational Functions with Transformations (Precalculus - College Algebra 39)
5.0 / 5 (0 votes)
Thanks for rating: