Graphing Quadratic Functions Using Transformations
TLDRThis lesson delves into graphing quadratic functions through transformations. Starting with the basic 'y = x^2', which forms an upward-opening U-shape, the instructor explains how a negative sign inverts the graph over the x-axis. Adding constants, like 'y = x^2 + 2', shifts the graph upward, while 'y = -x^2 - 1' shifts it down and opens downward. The lesson covers horizontal shifts with examples like 'y = (x - 1)^2', which moves the vertex right, and 'y = (x + 2)^2', which shifts left. The instructor also demonstrates combining transformations, such as 'y = -(x - 3)^2 + 2' and 'y = (x + 2)^2 - 4', detailing how to determine the vertex and direction of opening. The takeaway is that the sign in front of 'x^2' dictates the direction of the parabola, while constants and the position of the squared term affect the graph's vertical and horizontal shifts.
Takeaways
- 📚 The parent function for quadratic functions is y = x^2, which has a U-shaped graph that opens upward.
- 🔄 Adding a negative sign in front of the parent function, like y = -x^2, results in a reflection over the x-axis, causing the graph to open downward.
- 📈 The addition of a constant to the function, such as y = x^2 + 2, shifts the graph vertically upward by the value of the constant, starting at y = 2.
- 📉 A negative constant in the function, like y = -x^2 - 1, shifts the graph vertically downward by one unit and opens downward.
- 🔄 Squaring a binomial, such as y = (x - 1)^2, shifts the graph horizontally to the right by the value inside the parentheses, making the new vertex at (1,0).
- ↔️ Squaring a binomial with a negative outside, like y = -(x - 3)^2 + 2, shifts the graph 3 units to the right and 2 units up, with the graph opening downward.
- 🔄 Squaring a binomial with a positive outside, such as y = (x + 2)^2 - 4, shifts the graph 2 units to the left and 4 units down, with the graph opening upward.
- 📍 The vertex of a quadratic function can be determined by setting the binomial inside the parentheses to zero, which gives the x-coordinate of the vertex.
- 🔢 The direction in which the graph opens (upward or downward) is determined by the sign in front of the squared term: positive opens upward, negative opens downward.
- 📊 Transformations of the quadratic function graph include vertical and horizontal shifts, and changes in the direction of opening, which are represented by the sign in front of the squared term.
Q & A
What is the parent function for graphing quadratic functions?
-The parent function for graphing quadratic functions is y = x^2.
What is the shape of the graph of the parent function y = x^2?
-The graph of the parent function y = x^2 has a U-shape and opens upward.
What happens to the graph when a negative sign is placed in front of the parent function y = x^2?
-When a negative sign is placed in front of y = x^2, the graph reflects over the x-axis, facing downward instead of opening upward.
How does adding a plus two to the parent function affect the graph?
-Adding a plus two to the parent function (y = x^2 + 2) causes the graph to shift two units upward, starting at y = 2 and then opening upward.
What is the effect of a negative x squared minus one on the graph?
-A negative x squared minus one (y = -x^2 - 1) results in a vertical shift down one unit, starting at negative one, and the graph opens downward.
How does the graph of y = x - 1 squared change from the parent function?
-The graph of y = (x - 1)^2 shifts one unit to the right, with the new vertex located at x = 1.
What happens when x plus two squared is graphed?
-Graphing y = (x + 2)^2 results in a shift of two units to the left.
How does placing a negative sign in front of x plus two squared affect the graph?
-Placing a negative sign in front of x plus two squared (y = -(x + 2)^2) causes the graph to open downward.
What is the vertex of the graph y = x - 3 squared plus 2 with a negative sign in front?
-The vertex of the graph y = -(x - 3)^2 + 2 is at (3, 2), and it opens downward due to the negative sign.
What are the vertex coordinates and the direction of the graph for y = x plus 2 squared minus 4?
-For y = (x + 2)^2 - 4, the vertex coordinates are (-2, -4), and the graph shifts 2 units to the left and down 4 units, opening upward due to the positive x squared.
What determines whether a quadratic function opens upward or downward?
-A quadratic function opens upward if there is a positive x squared term, and it opens downward if there is a negative x squared term.
Outlines
📈 Understanding Quadratic Functions and Transformations
This paragraph introduces the concept of graphing quadratic functions through transformations. It begins with the parent function y = x^2, which has a U-shaped graph that opens upward. The discussion then explores the effects of adding a negative sign, resulting in a graph that opens downward. The paragraph also examines the impact of adding a constant term, like in y = x^2 + 2, which shifts the graph upward. Negative constants, as in y = -x^2 - 1, cause a downward shift. The paragraph further explains horizontal shifts, such as in y = (x - 1)^2, which shifts the graph to the right, and y = (x + 2)^2, which shifts it to the left. The effects of a negative sign in front of the squared term are also detailed, showing how it changes the direction in which the graph opens. Finally, the paragraph provides examples of combined transformations, like y = x - 3^2 + 2 and y = x + 2^2 - 4, and explains how to determine the vertex's location and the graph's opening direction based on the presence of positive or negative signs in the function.
Mindmap
Keywords
💡Graphing
💡Quadratic Functions
💡Parent Function
💡Transformations
💡Negative Sign
💡Vertical Shift
💡Horizontal Shift
💡Vertex
💡Opening Upward/Downward
💡Example Functions
Highlights
Lesson focuses on graphing quadratic functions using transformations.
Parent function is y = x^2 with a U-shaped graph that opens upward.
Adding a negative sign inverts the graph over the x-axis, making it face downward.
The graph y = x^2 + 2 shifts upward by 2 units.
A negative x squared opens the graph downward.
The graph y = -x^2 - 1 shifts down 1 unit and opens downward.
Graph y = (x - 1)^2 shifts one unit to the right.
Setting the inside equal to zero helps determine the vertex's x-coordinate.
Graph y = (x + 2)^2 shifts two units to the left.
Adding a negative sign in front of (x + 2)^2 opens the graph downward.
Graph y = -(x - 3)^2 + 2 shifts 3 units to the right and up 2 units.
The vertex for y = -(x - 3)^2 + 2 is at (3, 2), and it opens downward.
Graph y = x + 2^2 - 4 shifts 2 units to the left and down 4 units.
The vertex for y = x + 2^2 - 4 is at (-2, -4), and it opens upward.
A positive x^2 in the function opens the graph upward.
A negative x^2 in the function opens the graph downward.
Transcripts
Browse More Related Video
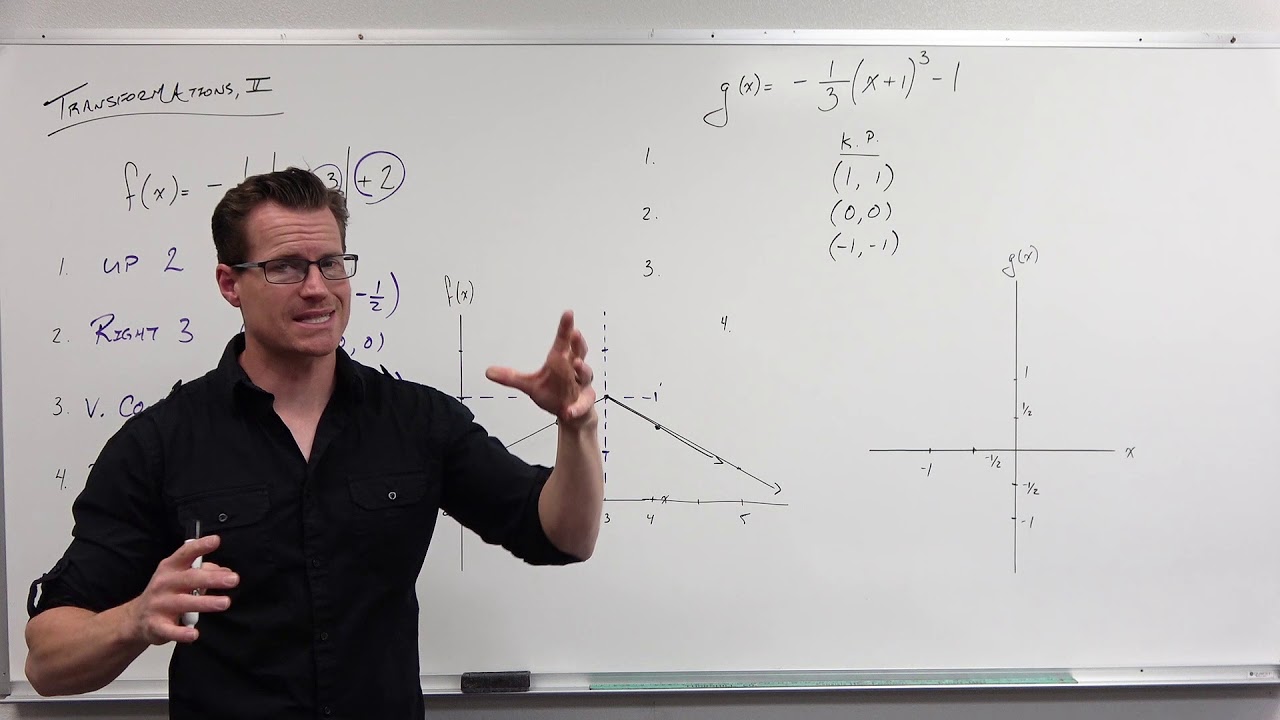
How to Graph with Transformations (Precalculus - College Algebra 15)

STANDARD EQUATION OF PARABOLA TO ITS GENERAL FORM
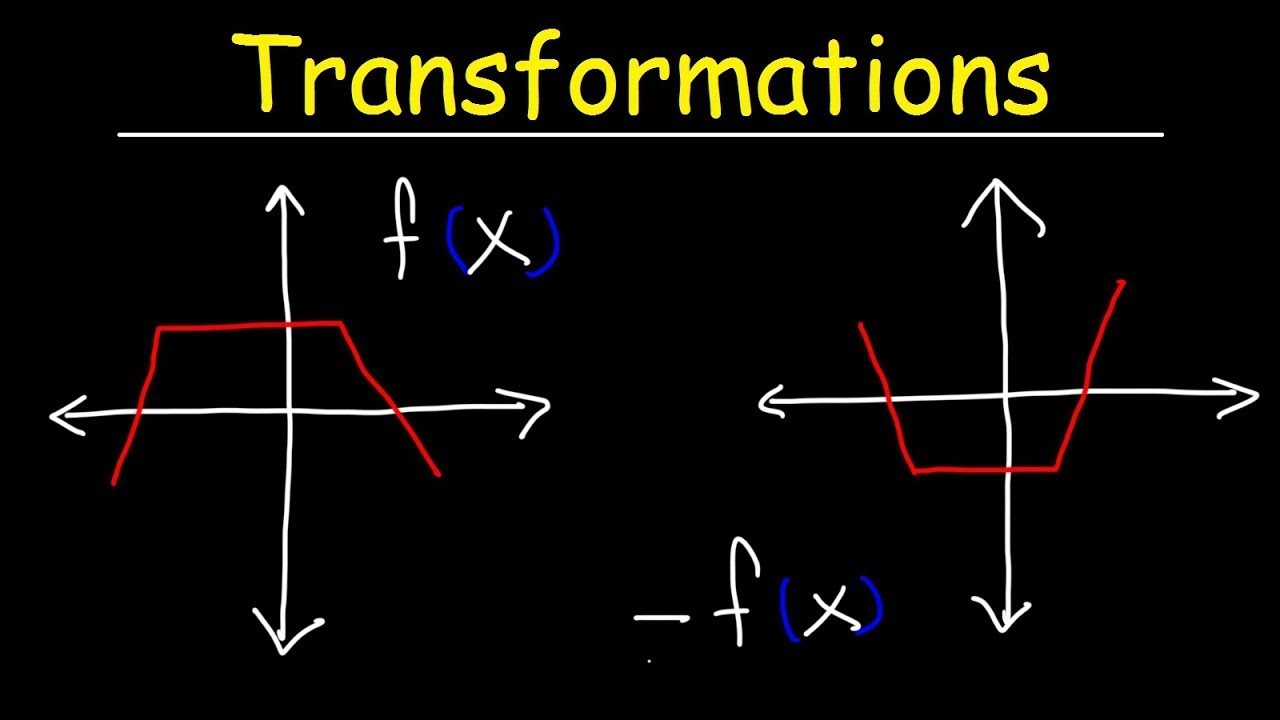
Transformations of Functions | Precalculus

Graphing Quadratic Functions Using a Data Table | Algebra
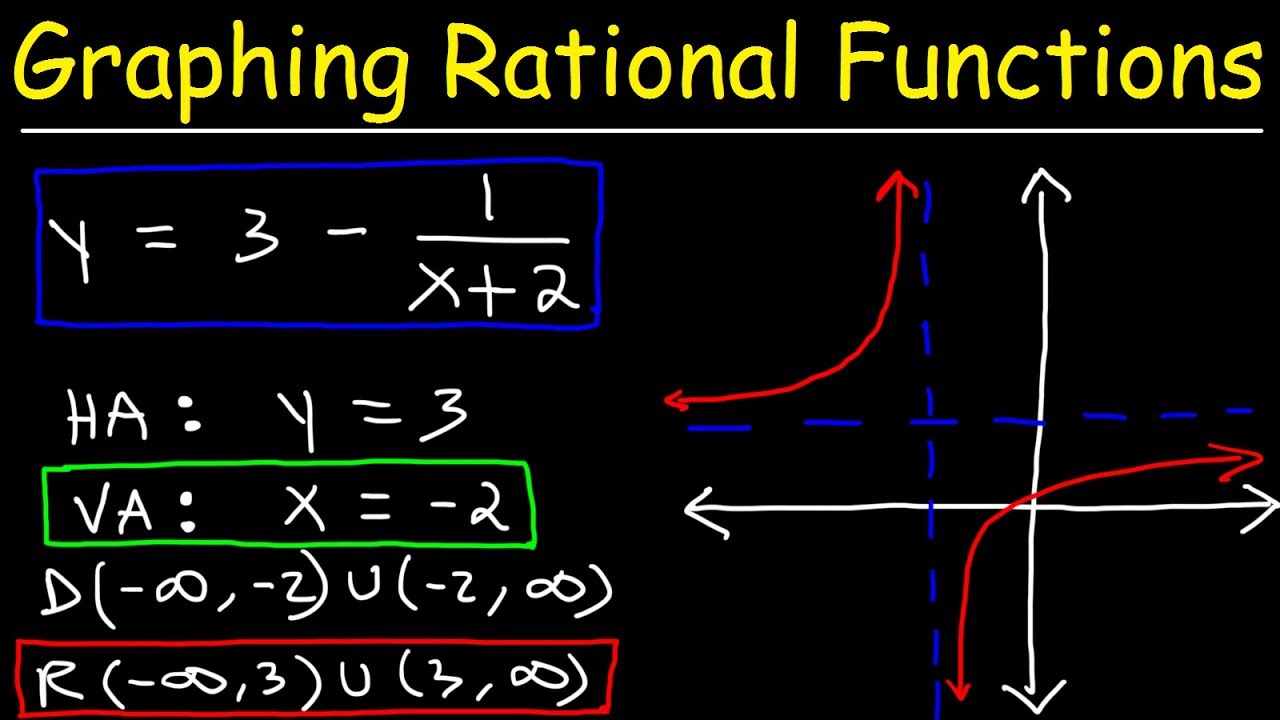
Graphing Rational Functions Using Transformations With Vertical and Horizontal Asymptotes
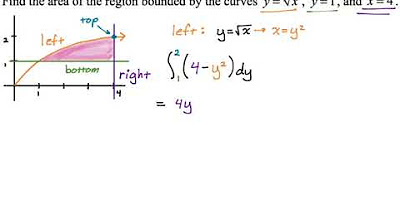
Area Between Curves: Integrating with Respect to y (Example 3)
5.0 / 5 (0 votes)
Thanks for rating: