How To Graph Radical Functions & Determine The Domain and Range
TLDRThis script provides an insightful guide on graphing radical functions with transformations. It explains how altering signs inside and outside the radical impacts the graph, such as flipping over the x-axis or y-axis, and reflecting over the origin. The concept of shifting the graph based on the function's structure, like 'square root of x minus two', is clarified with examples. Additionally, the script elucidates how to determine the domain and range of the function, using various scenarios to illustrate the process. The step-by-step approach makes it an informative resource for understanding the behavior of radical functions in different mathematical contexts.
Takeaways
- 📈 The lesson focuses on graphing radical functions using transformations, specifically the square root function √x.
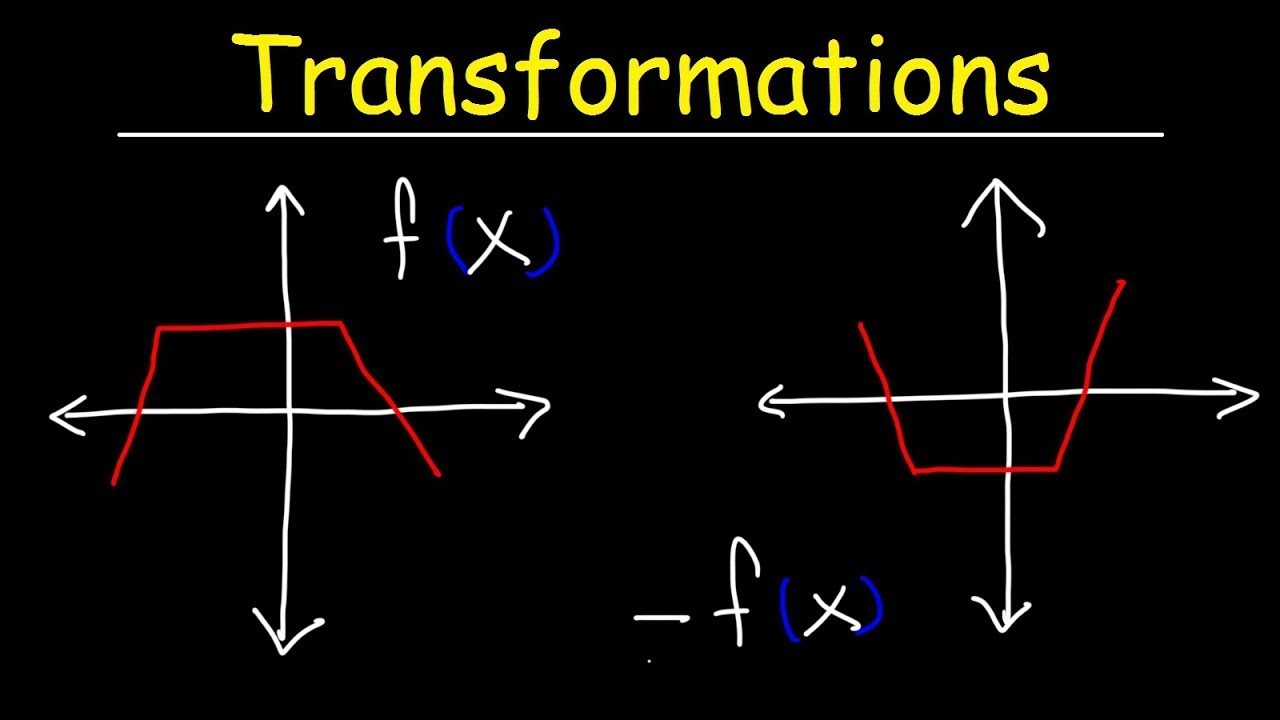
- 🔄 Transformations include flipping over the x-axis with a negative sign in front of the function, reflecting over the y-axis with a negative sign inside the radical, and reflecting over the origin with both a negative sign inside and outside the radical.
- 🧭 To determine the direction of the graph, associate the sign in front of 'x' with the horizontal direction (right for positive, left for negative) and the sign outside the radical with the vertical direction (up for positive, down for negative).
- 🔠 The general shape of the graph is affected by operations inside the radical. For example, √(x - 2) shifts the graph two units to the right, and √(x + 3) shifts it three units to the left.
- 🔼 The graph's vertical shift is determined by a constant added outside the radical. √x + 1 shifts the graph up by one unit, opening towards the right.
- 🔽 Negative radical functions, like -√x - 2, shift the graph downward and reflect it towards quadrant four.
- 📌 To graph a function, find the new origin by setting the inside of the radical equal to zero and applying any shifts indicated by the function's form.
- 📈 The domain of a function is determined by the range of x-values, considering the transformations and shifts applied to the parent function.
- 📉 The range of a function is determined by the resulting y-values after applying the function's transformations and shifts.
- 📊 When graphing, choose x-values that result in perfect squares to easily find corresponding y-values and plot points on the graph.
- 📋 For complex radical functions, like 3 - √(4 - x), the graph's direction and shape are influenced by both the operations inside the radical and the constants outside it.
Q & A
What is the parent function discussed in the lesson?
-The parent function discussed in the lesson is the square root of x (√x).
What happens when a negative sign is placed in front of the radical function?
-When a negative sign is placed in front of the radical function, it flips over the x-axis, reflecting the graph over the x-axis.
What is the effect of placing a negative sign inside the radical function?
-Placing a negative sign inside the radical function reflects the graph over the y-axis.
How does the graph of the function change when both the inside and outside of the radical have a negative sign?
-When both the inside and outside of the radical have a negative sign, the graph reflects over the origin.
What is the new origin when the function is √(x - 2)?
-The new origin when the function is √(x - 2) is the point (2, 0), as setting the inside part (x - 2) equal to zero gives x = 2.
In which quadrant does the graph of √(x - 1 + 2) shift?
-The graph of √(x - 1 + 2) shifts one unit to the right and up by two units, moving towards the first quadrant.
What are the domain and range of the function √(3 - x) + 1?
-The domain of the function √(3 - x) + 1 is from negative infinity to 3, and the range is from 1 to infinity, as the lowest x value is 3 and the highest y value is infinity.
How does the graph of the function 3 - √(4 - x) change when a 2 is placed in front of the radical?
-When a 2 is placed in front of the radical, the graph of the function 3 - √(4 - x) doubles the change in the y-value, making the shifts and movements in the graph twice as large.
What is the new origin for the function 2√(x + 1) - 3?
-The new origin for the function 2√(x + 1) - 3 is (-1, -3), as setting the inside part (x + 1) equal to zero gives x = -1.
What are the domain and range of the function 2√x + 1 - 3?
-The domain of the function 2√x + 1 - 3 is from negative 1 to infinity, and the range is from negative 3 to infinity, as the lowest x value is -1 and the lowest y value is -3.
Outlines
📊 Graphing Radical Functions with Transformations
This paragraph discusses the process of graphing radical functions, specifically focusing on how transformations affect the graph. The parent function, square root of x, is introduced and its behavior in the coordinate plane is explained. The effects of placing a negative sign in front of the function or inside the radical are explored, leading to reflections over the x-axis, y-axis, and the origin. A mnemonic is provided to help remember the direction in which the graph will travel based on the signs of x and y. Several examples are given, each demonstrating how changes to the function (such as adding or subtracting values inside the radical) result in shifts and reflections of the graph. The domain and range of the function are also discussed, with examples showing how to determine these aspects for different radical functions.
📐 Shifts and Direction in Radical Function Graphs
The second paragraph delves deeper into the specifics of how shifts and direction are determined when graphing radical functions. It explains how setting the inside of the radical to zero helps identify the shifts on the x-axis, and how the signs in front of x and the radical affect the direction of the graph. The paragraph uses examples to illustrate how to find points on the graph by considering the direction towards the quadrants and the changes in x and y values. The domain and range of the functions are calculated, providing a clear understanding of the input and output values for the given examples. The paragraph emphasizes the importance of understanding the relationship between x and y values in determining the graph's trajectory.
📉 Determining Domain and Range for Radical Functions
This paragraph focuses on the domain and range of radical functions, using several examples to demonstrate how to calculate these aspects. It explains how to find the shifts and changes in the graph by setting expressions inside the radical equal to zero and determining the direction in which the graph will travel based on the signs of the coefficients. The paragraph provides a clear methodology for plotting points on the graph and emphasizes the importance of choosing x values that result in perfect squares for easier calculation. The domain and range for each example are calculated, showing the range of possible x and y values. The paragraph concludes with a comprehensive explanation of how to graph radical functions and determine their domain and range, reinforcing the concepts introduced throughout the discussion.
Mindmap
Keywords
💡Radical functions
💡Transformations
💡Quadrants
💡Graphing
💡Domain and Range
💡Shifting
💡Reflecting
💡Origin
💡Perfect squares
💡Signs
💡Coordinate system
Highlights
The lesson focuses on graphing radical functions using transformations.
The parent function is the square root of x, which increases at a decreasing rate and travels towards quadrant one.
A negative sign in front of the function flips it over the x-axis, reflecting it over the x-axis.
A negative sign inside the radical reflects the function over the y-axis.
A negative sign both outside and inside the radical reflects the function over the origin.
The sign in front of x is associated with the direction towards the right, and the sign outside the radical with the direction upwards for positive y.
The graph travels towards different quadrants based on the signs of x and y.
The graph of the square root of x minus two shifts two units to the right.
The new origin for the graph of square root of x plus three is at (2, 0) due to the positive sign in front of x.
The graph of square root of x plus one opens upwards and to the right.
The graph of negative square root x minus 2 shifts down and is reflected towards quadrant four.
The graph of square root of x minus one shifts one unit to the right and up by two units, with the new origin at (1, 2).
The domain and range of the function can be determined by considering the x and y values and their restrictions.
For the function square root of three minus x plus one, the graph shifts three units to the right and up by one unit.
The direction of the graph's travel can be deduced from the signs in front of x and y.
The graph of y equals 3 minus the square root of 4 minus x starts at (4, 3) and travels towards quadrant three.
When graphing radical functions, perfect squares should be chosen for x values after the new origin for simplicity.
The domain and range of a function are crucial for understanding the behavior and possible outputs of the function.
Transcripts
Browse More Related Video
Transformations of Functions | Precalculus
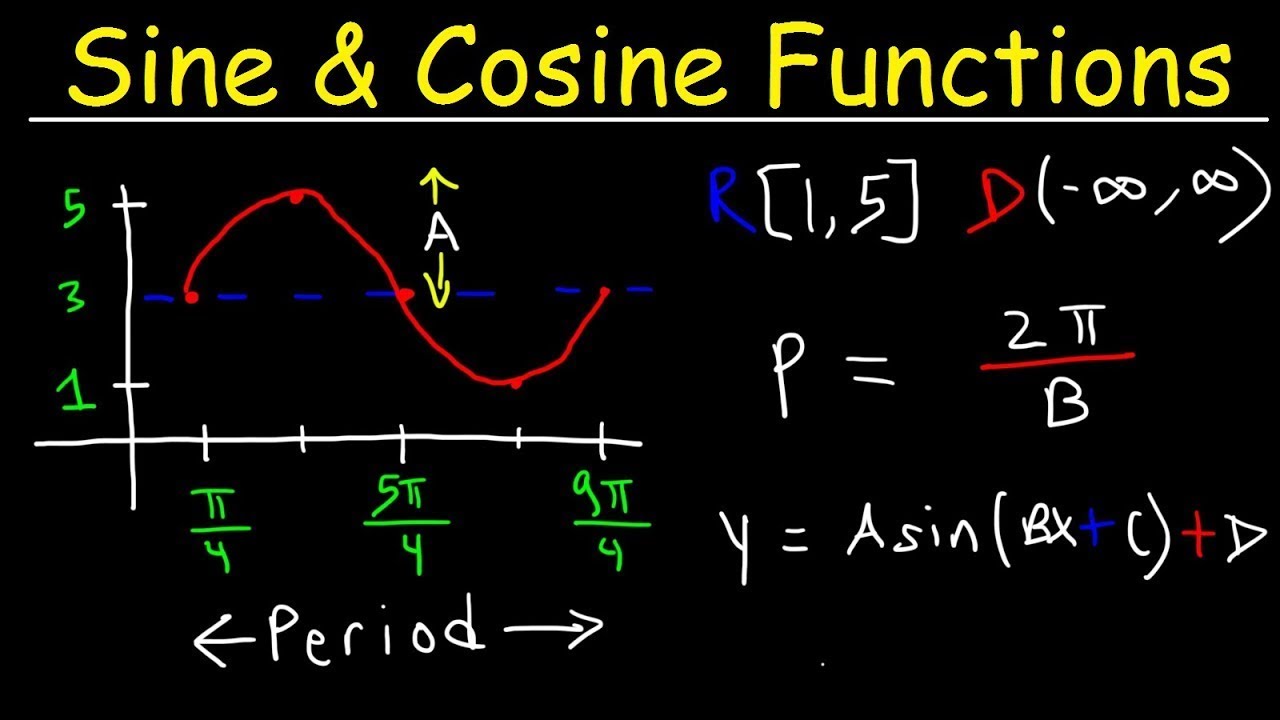
How To Graph Trigonometric Functions | Trigonometry
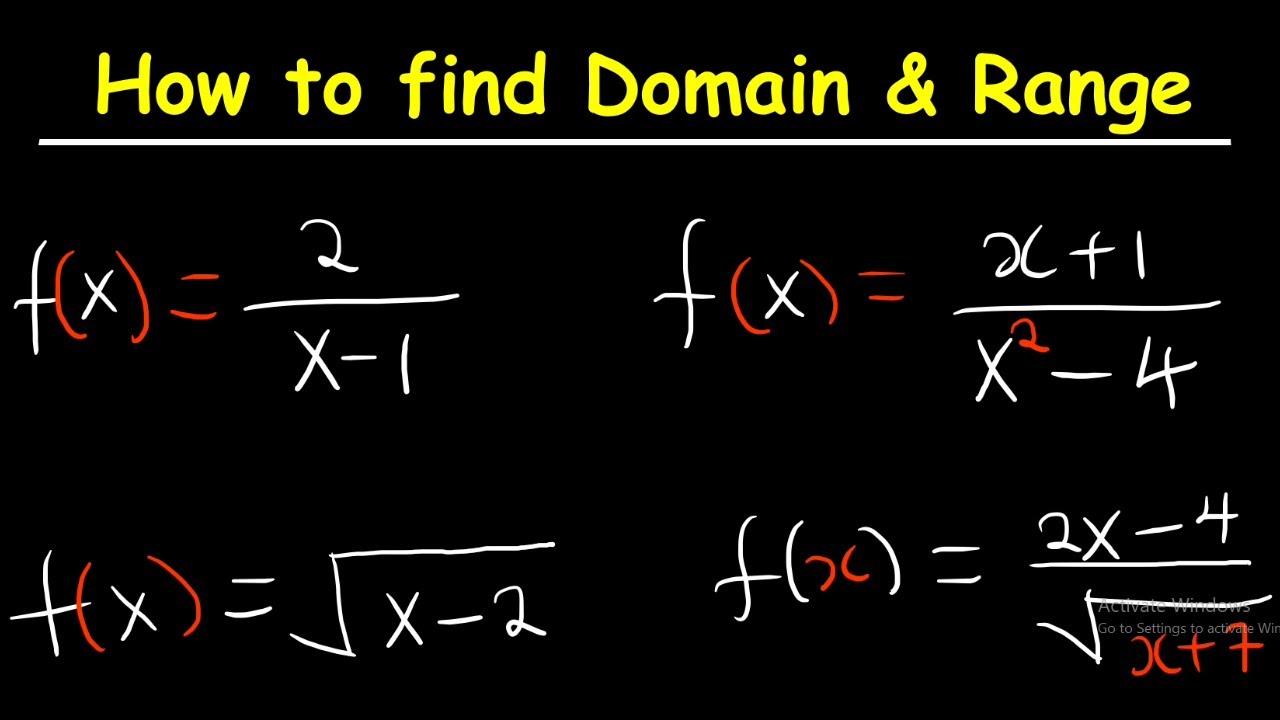
Domain and Range of a Function
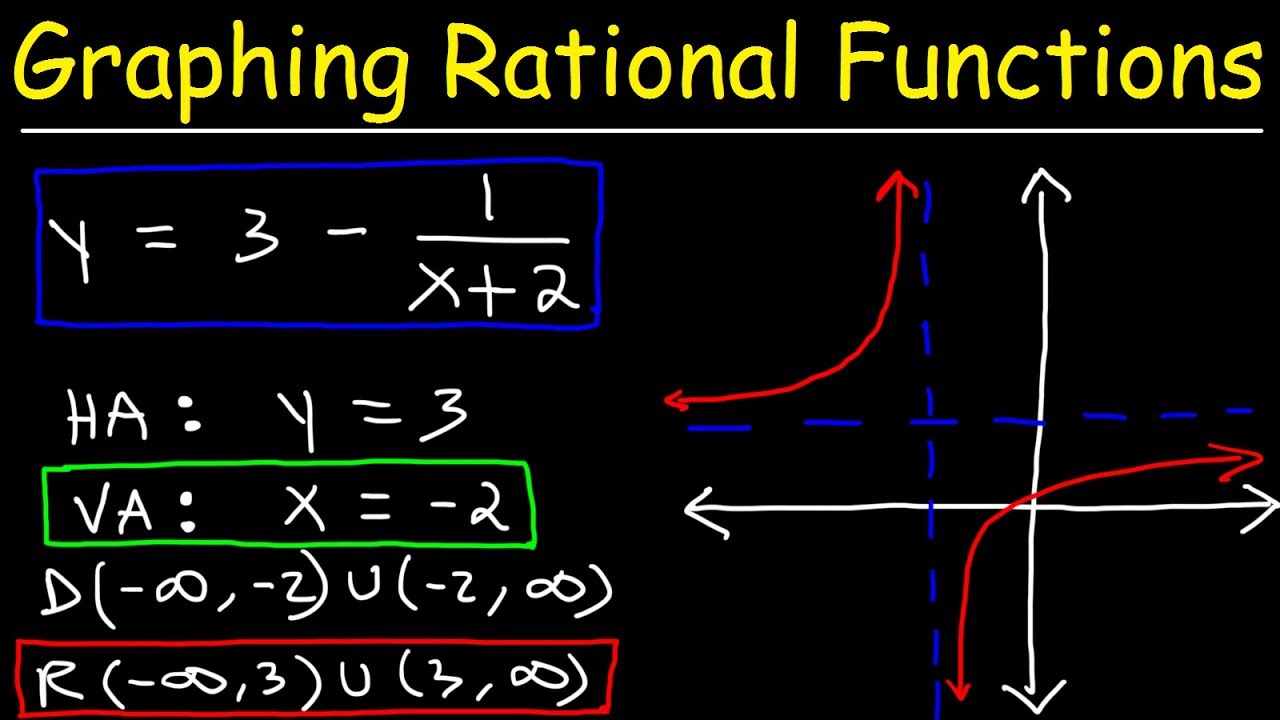
Graphing Rational Functions Using Transformations With Vertical and Horizontal Asymptotes

Graphing Transformations with Sine and Cosine (Precalculus - Trigonometry 12)

Features of Graphs, Domain, Range (Precalculus - College Algebra 7)
5.0 / 5 (0 votes)
Thanks for rating: