Introduction to Graph Transformations (Precalculus - College Algebra 14)
TLDRThe video script delves into the concept of graph transformations, a fundamental topic in mathematics that involves altering the shape and position of graphs of functions. The presenter emphasizes the importance of understanding these transformations to avoid the tedious process of plotting numerous points. They introduce the idea of vertical shifts, explaining how adding or subtracting a constant outside a function affects the graph's vertical position without changing the input values. Horizontal shifts are also discussed, highlighting the counterintuitive nature of these transformations where adding to the input results in a leftward shift and subtracting results in a rightward shift. The script further explores vertical stretches and compressions, which involve multiplying the output values by a constant, leading to a narrower or wider graph, respectively. The presenter also touches on the concept of reflections, where the sign of either the output or input is changed, resulting in the graph being reflected over the x-axis or y-axis. The summary concludes with a teaser for the next video, where these concepts will be combined for a comprehensive understanding of their effects on graphing.
Takeaways
- 📈 Understanding transformations is crucial for graphing functions without needing to plot numerous points, which can be time-consuming and may miss key features of the graph.
- ⏱️ Memorizing the basic shapes and key points of library functions helps in quickly identifying how transformations like shifts, stretches, compressions, and reflections will affect a graph.
- ↕️ Vertical shifts are achieved by adding or subtracting a constant to the output of a function, resulting in an upward or downward movement of the graph.
- ↔️ Horizontal shifts occur when a constant is added or subtracted to the input of a function before it undergoes any transformation, causing the graph to move left or right.
- 🔢 The concept of vertical stretch and compression involves multiplying the output of a function by a constant, which makes the graph narrower (stretch) or wider (compress).
- 🔄 Horizontal stretch and compression can often be converted into vertical stretch and compression, and vice versa, which is particularly useful in trigonometry.
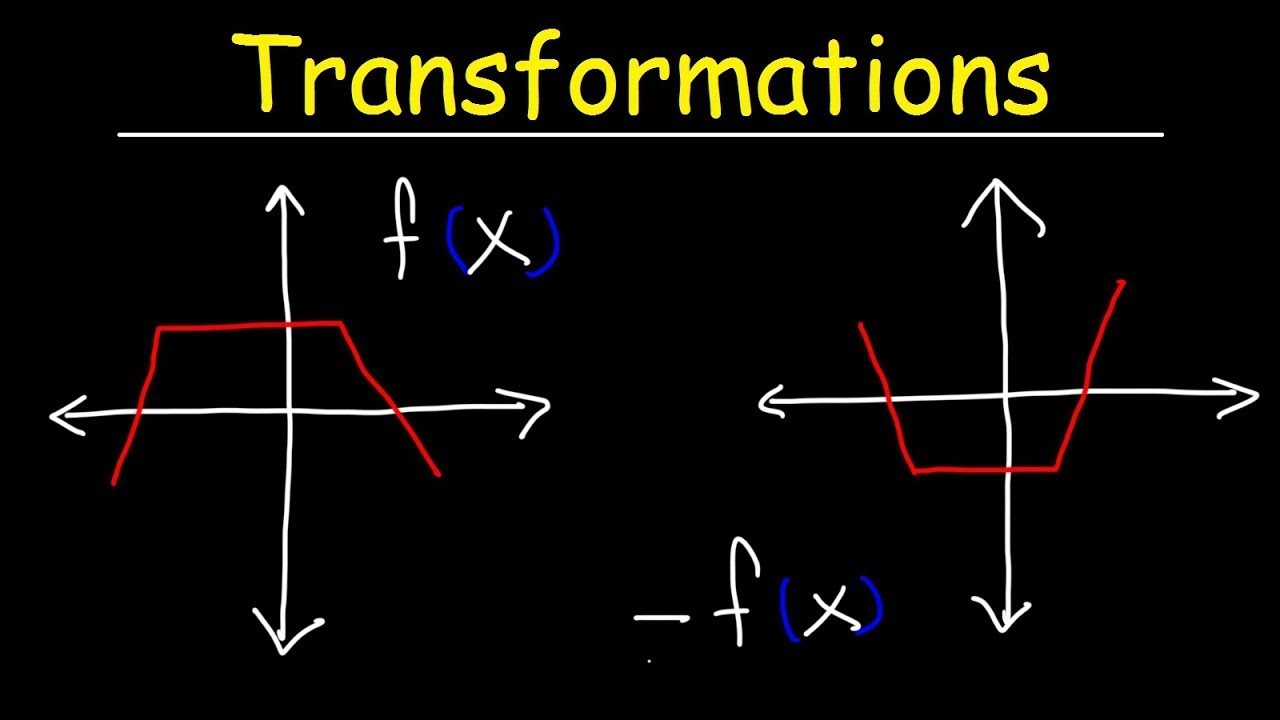
- 🔁 Reflections about the x-axis or y-axis involve changing the sign of the output or input, respectively, which flips the graph over the x-axis or y-axis.
- 📊 Recognizing the basic graph shapes and their key points is essential before applying transformations to predict how the graph will change.
- 🤔 Students often find horizontal shifts counterintuitive because adding to the input (which shifts left) and subtracting from the input (which shifts right) is the opposite of what one might initially expect.
- 📐 Using a technique of shifting the x-axis and y-axis on the graph can help visualize and plot the key points of the transformed function more effectively.
- 🧮 For accuracy, after applying the transformations, one can plug in specific values to fine-tune the graph and ensure it captures all the essential features of the function.
- ⚖️ Both vertical stretches and compressions, as well as reflections, change the aspect ratio of the graph, making it appear taller and narrower or shorter and wider, respectively.
Q & A
What are transformations in the context of graphing functions?
-Transformations refer to the various ways a basic graph shape can be altered. This includes shifting the graph up, down, left, or right; stretching or compressing it horizontally or vertically; and reflecting it across the x-axis or y-axis.
Why is it important to understand transformations when graphing functions?
-Understanding transformations is important because it allows us to predict how the graph of a function will be affected without having to plot numerous points. This is especially useful for complex or infinite functions like trigonometric functions, where plotting every point is impractical.
What is a vertical shift in the context of graphing functions?
-A vertical shift occurs when we add or subtract a constant to the output value of a function. This results in the graph of the function moving up or down without changing the x-values.
How does adding a positive number outside the parentheses of a function affect the graph?
-Adding a positive number outside the parentheses of a function results in a vertical shift upward. Each output value of the function is increased by that number, causing the graph to move up by the corresponding units.
How does adding a negative number outside the parentheses of a function affect the graph?
-Adding a negative number outside the parentheses of a function results in a vertical shift downward. Each output value of the function is decreased by that number, causing the graph to move down by the corresponding units.
What is a horizontal shift in the context of graphing functions?
-A horizontal shift occurs when we add or subtract a constant inside the parentheses of a function. This affects the input values before they are processed by the function, resulting in the graph moving left or right.
Why might students commonly confuse the direction of a horizontal shift?
-Students often confuse the direction of a horizontal shift because it is the opposite of what their intuition might suggest. Adding a number inside the parentheses (which affects the input) actually shifts the graph in the opposite direction of what is added or subtracted.
What is a vertical stretch or compression of a graph?
-A vertical stretch or compression occurs when we multiply the output values of a function by a constant factor. If the factor is greater than 1, it stretches the graph vertically, making it narrower. If the factor is less than 1, it compresses the graph vertically, making it wider.
What is the relationship between vertical stretches/compressions and horizontal stretches/compressions?
-Vertical stretches and compressions can often be converted into horizontal stretches and compressions, and vice versa. This is because stretching a graph in one direction will typically compress it in the perpendicular direction, and vice versa.
What is a reflection of a graph over the x-axis?
-A reflection of a graph over the x-axis occurs when we change the sign of the output values of the function. This flips the graph over the x-axis, so that points that were above the x-axis move below it, and points that were below move above it.
What is a reflection of a graph over the y-axis?
-A reflection of a graph over the y-axis occurs when we change the sign of the input values before they are processed by the function. This reflects the graph across the y-axis, so that the entire graph appears on the opposite side of the y-axis.
Outlines
📈 Understanding Function Transformations
This paragraph introduces the concept of function transformations, emphasizing the importance of not just memorizing library functions but also understanding how to apply transformations to these functions. The focus is on how operations can affect basic graph shapes, such as moving, stretching, compressing, or reflecting them. The goal is to be able to visualize these transformations without having to plot numerous points.
🔄 Vertical Shifts in Graphs
The second paragraph delves into vertical shifts, explaining how adding or subtracting a constant outside a function affects the graph by moving it up or down. The key takeaway is that this type of transformation only impacts the output values, not the input, resulting in a vertical shift of the graph.
🔄 Horizontal Shifts and Their Intuitions
This part discusses horizontal shifts, which occur when an input value is altered before it's processed by a function. The explanation clarifies that despite intuition suggesting otherwise, adding to an input value results in a shift to the left, while subtracting results in a shift to the right. The paragraph uses analogies and examples to help students grasp this concept.
📊 Graphing Techniques with Shifts
The fourth paragraph provides a unique method for graphing functions with shifts by conceptually moving the axes rather than the graph itself. This approach simplifies the graphing process by allowing the plot of key points based on the new, hypothetical axis positions, which helps in determining the final location of the graph.
🔍 Identifying Shifts and Graphing Functions
This section focuses on identifying the basic graph shape of a function and its key points before applying transformations. It explains how to account for shifts by adjusting the axes and then plotting the graph based on these new references. The importance of understanding the function's behavior rather than just plugging in points is emphasized.
🔢 Vertical Stretch and Compression
The sixth paragraph explains the concept of vertical stretch and compression. It describes how multiplying the output of a function by a constant factor greater than one results in a vertical stretch, making the graph narrower, whereas a factor less than one results in a compression, making the graph wider.
🔄 Horizontal Stretch and Compression
The seventh paragraph discusses horizontal stretch and compression, noting that these transformations often have the opposite intuitive effect. It explains that a number greater than one in the function results in a horizontal compression, while a number less than one results in a stretch. The relationship between vertical and horizontal transformations is highlighted.
🤔 Reflections and Their Effects on Graphs
The eighth paragraph covers reflections, which involve changing the sign of either the input or output of a function. This results in the graph being reflected across the x-axis or y-axis. The explanation clarifies how to determine whether a reflection affects the input or output and the resulting changes to the graph's appearance.
🔬 Combining Transformations for Advanced Graphing
The final paragraph summarizes the upcoming discussion on combining various transformations—vertical and horizontal shifts, stretches, compressions, and reflections—to understand their cumulative effects on graphing functions. It sets the stage for a more comprehensive approach to visualizing and plotting mathematical functions.
Mindmap
Keywords
💡Transformations
💡Vertical Shift
💡Horizontal Shift
💡Stretching and Compression
💡Reflections
💡Key Points
💡Absolute Value
💡Square Root
💡Cubic Function
💡Trigonometric Functions
Highlights
The video introduces the concept of graph transformations, explaining how mathematical operations affect the graph of a function.
Emphasizes the importance of understanding transformations to efficiently graph functions without evaluating numerous points.
Discusses the impact of vertical shifts on the graph of a function, demonstrating how adding or subtracting affects the output value.
Explains the concept of horizontal shifts, clarifying the common misconception that adding to the input results in a shift to the right.
Introduces a unique method for graphing transformations by 'shifting' the x-axis and y-axis conceptually to align with the transformations.
Provides a step-by-step guide on how to apply vertical shifts to the graph of x squared plus three.
Details how to identify and apply horizontal shifts to the graph of an absolute value function, such as absolute value of x plus two.
Discusses the effect of vertical stretches and compressions on the graph, showing how multiplying the output value affects the graph's width.
Explains that a vertical stretch results in a horizontal compression and vice versa, due to the inverse relationship between the two transformations.
Demonstrates how to apply horizontal stretches and compressions by addressing the inside of the function with an example of f(x) = 3x squared.
Clarifies that reflections about the x-axis or y-axis involve changing the sign of the output or input, respectively.
Illustrates the effect of reflections on the graph of a cube root function, showing how the graph flips over the x-axis or y-axis.
Advises that understanding the shapes and key points of basic library functions is crucial for effectively applying transformations.
Intends to combine multiple transformations in the next video, practicing vertical shifts, horizontal shifts, stretches, compressions, and reflections simultaneously.
Encourages students to grasp the concept of transformations for easier graphing of complex functions, such as those in trigonometry.
The video concludes with a summary of the key points covered and a preview of upcoming content focusing on combining transformations.
Transcripts
Browse More Related Video
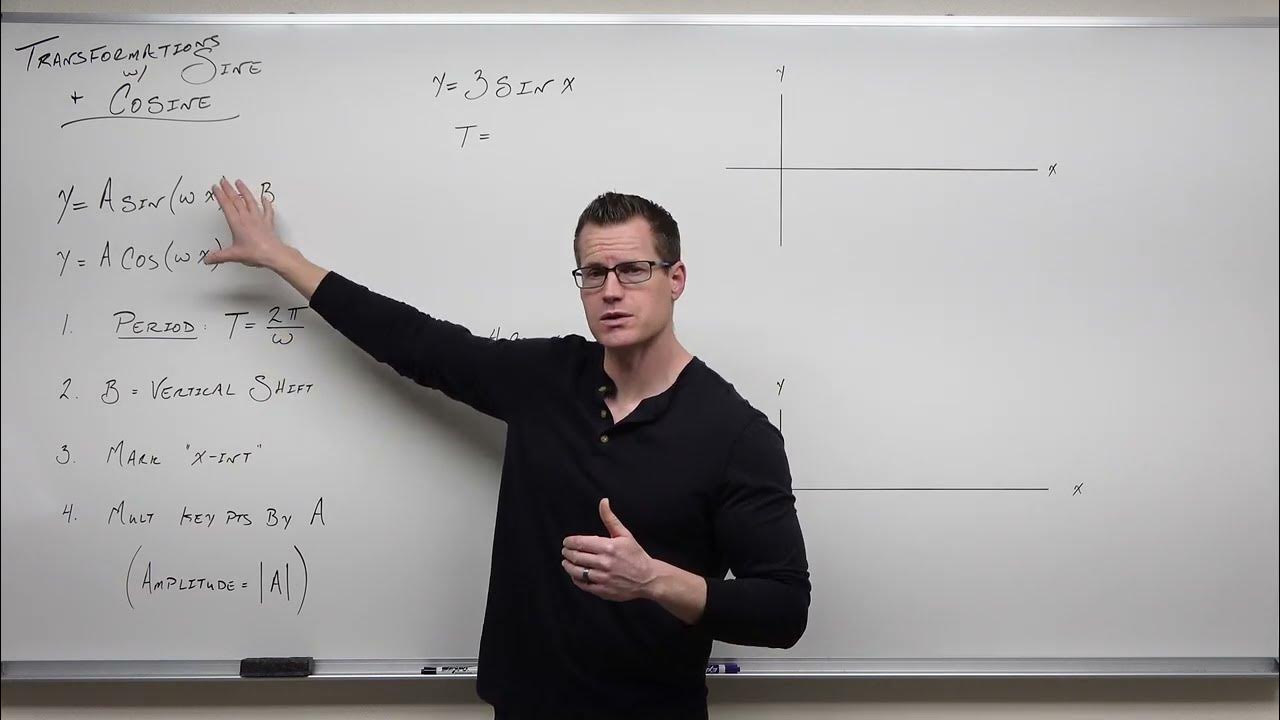
Graphing Transformations with Sine and Cosine (Precalculus - Trigonometry 12)
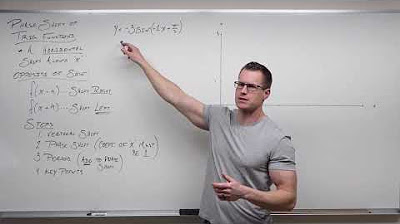
How to Graph Phase Shifts of Trigonometric Functions (Precalculus - Trigonometry 16)
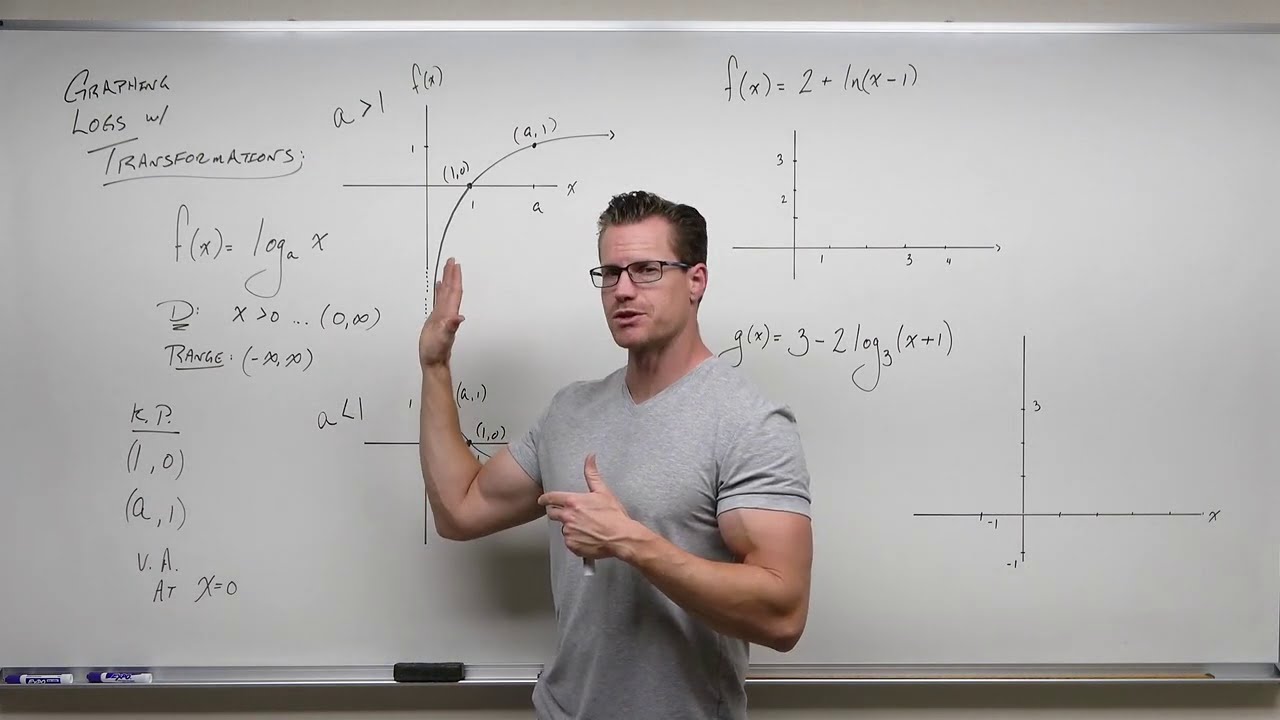
Graphing Logarithms with Transformations (Precalculus - College Algebra 56)
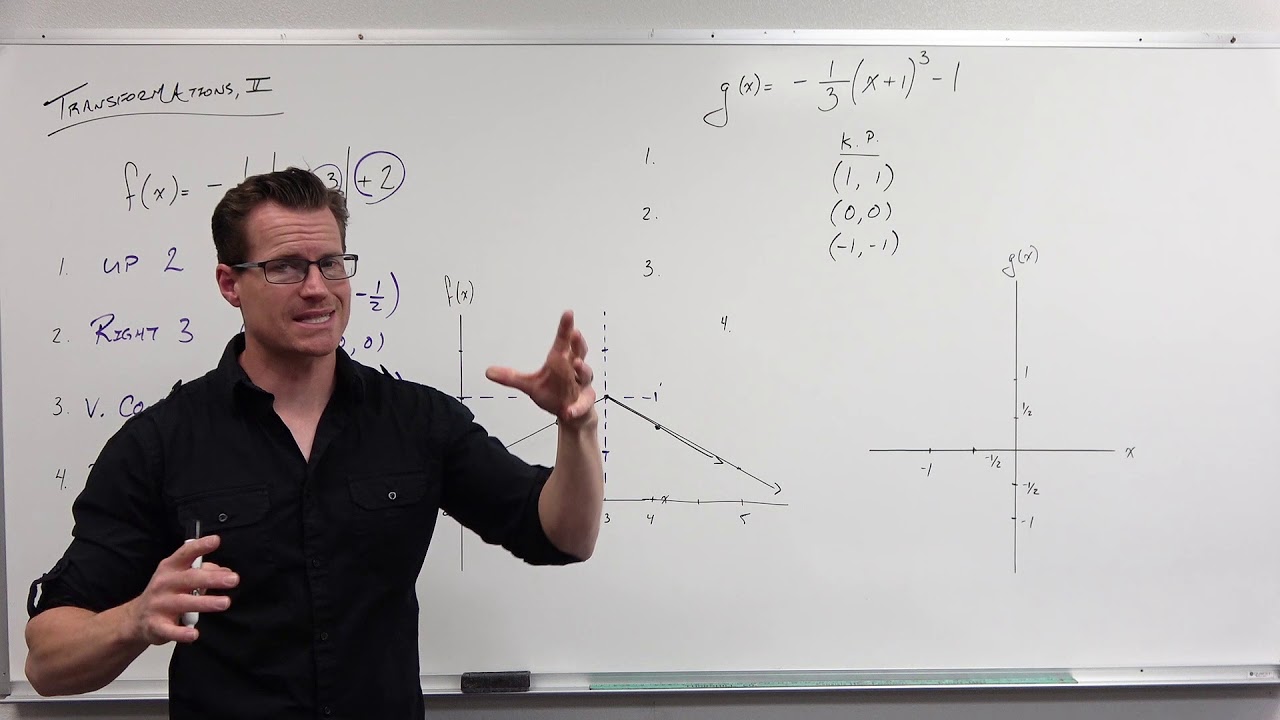
How to Graph with Transformations (Precalculus - College Algebra 15)
Transformations of Functions | Precalculus
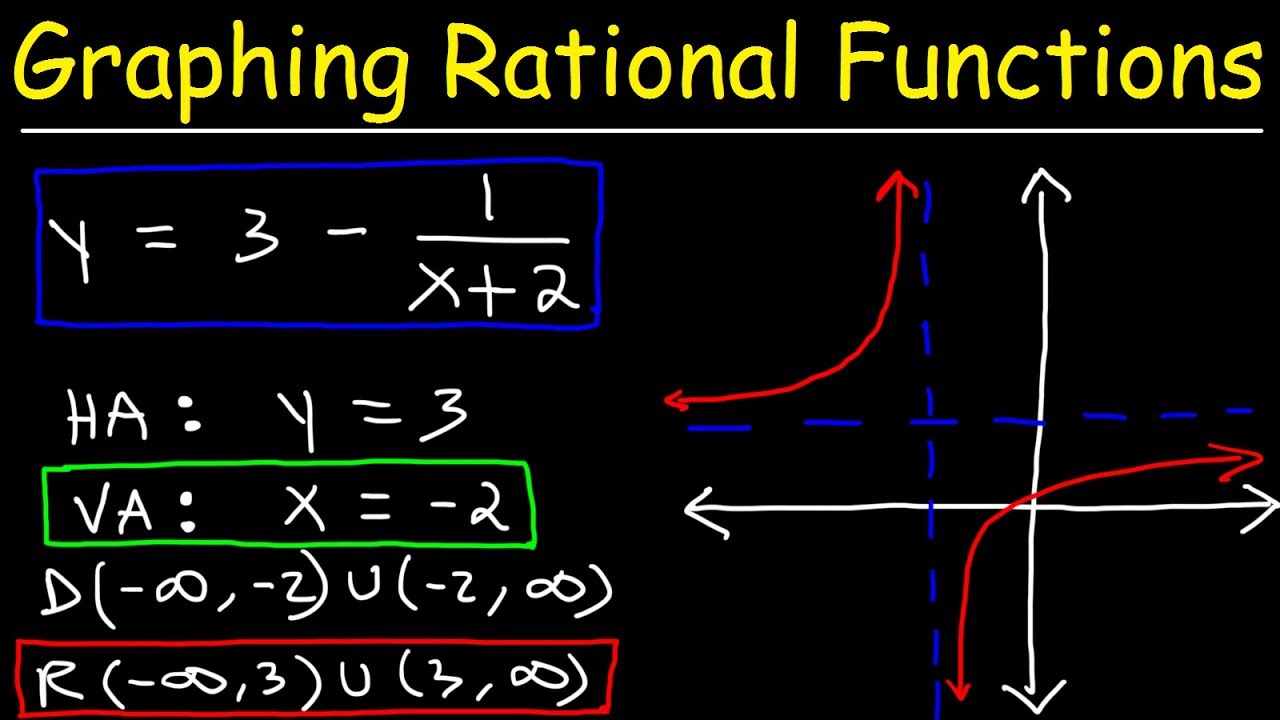
Graphing Rational Functions Using Transformations With Vertical and Horizontal Asymptotes
5.0 / 5 (0 votes)
Thanks for rating: