Graphing Transformations with Sine and Cosine (Precalculus - Trigonometry 12)
TLDRThis video tutorial offers an in-depth exploration of graphing sine and cosine functions with various transformations. The presenter begins by emphasizing the importance of understanding the period of these trigonometric functions and how it can be adjusted, leading to horizontal stretches or compressions. The concept of amplitude is introduced next, explaining how multiplying the function affects the output's magnitude and can result in reflections if the coefficient is negative. The video then delves into the process of shifting the graph, differentiating between vertical shifts (up or down) and phase shifts (left or right). A step-by-step approach is presented for graphing, which includes identifying the period, any vertical shifts, marking x-intercepts, and plotting key points. The instructor provides clear examples of graphing equations like y = 3sin(x), y = -4cos(x), and variations with phase shifts, showcasing how to apply these principles to manipulate the graph accordingly. The comprehensive guide is designed to equip viewers with the skills to confidently graph a wide array of trigonometric functions, preparing them for more complex transformations in future lessons.
Takeaways
- 📐 Understanding the period of a trigonometric function is crucial for graphing; it determines how often the function repeats.
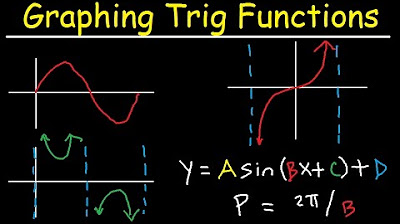
- 🔄 Multiplying the inside of the argument of a trig function (like b · x where b is the coefficient) adjusts the period, causing a horizontal stretch or compression.
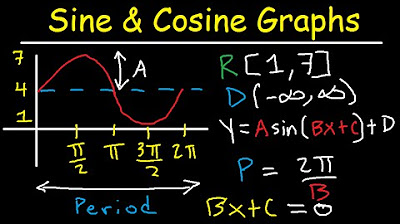
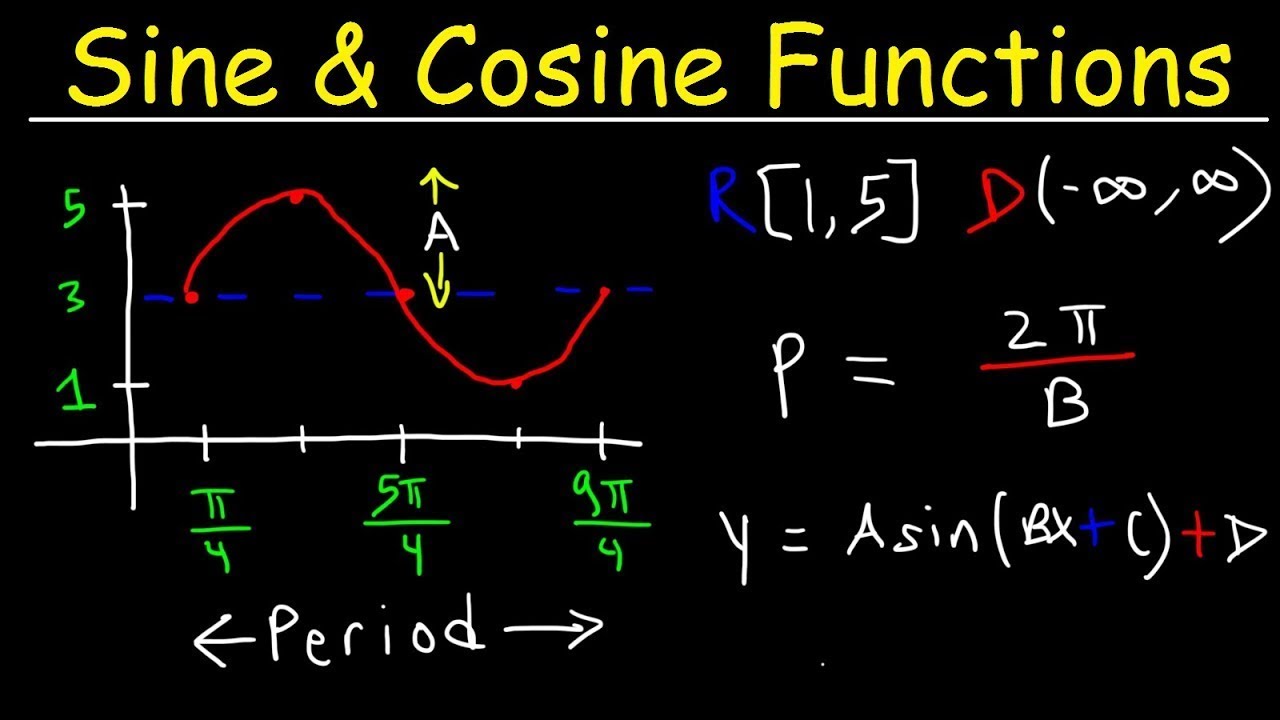
- 📈 Multiplying the function itself (like A · sin(x) where A is the coefficient) affects the amplitude, which is the height of the peaks above or below the x-axis.
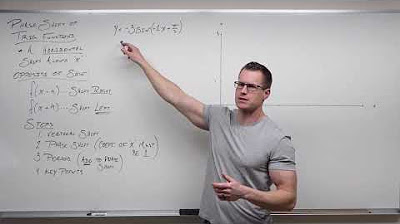
- 🔀 Adding or subtracting inside the function (like sin(x ± C) ) results in a phase shift, which is a horizontal shift to the left or right.
- ↕️ Vertical shifts are indicated by adding or subtracting outside the function (like sin(x) + D where D is the number to shift by).
- 🏁 Sine functions have x-intercepts at the endpoints and center of the period, while cosine functions have x-intercepts at the quarters.
- 🔺 Key points for sine are typically at the first and third quarters of the period, and for cosine, they are at the endpoints and center.
- ⚖️ The amplitude A can cause both stretching (change in height of peaks) and reflecting (inversion of the graph) if A is negative.
- 🔁 To graph a trig function, follow these steps: find the period, identify vertical shifts, mark x-intercepts, and plot key points.
- ➗ For tangent functions, the period is π instead of 2π, and the same process of adjusting for transformations applies.
- 🚫 Avoid common mistakes like factoring out a negative sign incorrectly from the argument of the function; use the properties of odd and even functions instead.
Q & A
What is the first step in graphing a sine or cosine function?
-The first step in graphing a sine or cosine function is to find the period of the function. For sine and cosine, the original period is 2π, and this is adjusted based on the coefficient in front of 'x' in the function.
How does the coefficient in front of 'x' in a trigonometric function affect the graph?
-The coefficient in front of 'x' affects the period of the trigonometric function, causing a horizontal stretch or compression. If the coefficient is greater than 1, the graph is compressed, and if it's less than 1, the graph is stretched.
What is the significance of the value 'a' in the function y = a * sin(x) or y = a * cos(x)?
-The value 'a' affects the amplitude of the graph, which is the height of the peaks above the x-axis and the depth of the valleys below the x-axis. 'a' can also cause a reflection if it is negative.
How do you identify the vertical shift in a trigonometric function?
-A vertical shift is identified by any value added or subtracted outside the function's parentheses. If there's a '+' sign, it indicates an upward shift, and a '-' sign indicates a downward shift.
What is a phase shift, and how is it different from a vertical shift?
-A phase shift is a horizontal transformation, where the graph is shifted left or right. It is different from a vertical shift, which is an upward or downward movement of the graph. A phase shift occurs when there is a value added or subtracted inside the function's parentheses.
How does the period of tangent differ from that of sine and cosine?
-The period of tangent is π, which is half of the period of sine and cosine. This is because the tangent function repeats its values every π, as opposed to every 2π for sine and cosine.
What are key points in the context of graphing trigonometric functions?
-Key points are specific points on the graph of a trigonometric function that help define its shape. For sine, they are typically the peaks at the quarters of the period, and for cosine, they are the peaks at the ends and center of the period.
What is the process for graphing the function y = -4 cos(x)?
-First, identify the period, which is 2π for cosine divided by 1, so it remains 2π. Next, recognize the vertical shift, which is -4, indicating a downward shift. Then, identify the x-intercepts, which for cosine occur at the quarters. Finally, adjust the key points (1, 0, and -1 for cosine) by multiplying by -4 to account for the amplitude and reflection.
Why is it important to plot the key points in relation to the shifted axis when graphing trigonometric functions?
-Plotting key points in relation to the shifted axis helps to visualize the graph accurately without having to calculate numerous points. It accounts for the vertical and horizontal shifts, reflections, and stretches or compressions applied to the function.
How can you determine the function's amplitude if you know the period and the function is reflected?
-The amplitude is the absolute value of the 'a' in the function y = a * sin(x) or y = a * cos(x). If the function is reflected, it means 'a' is negative. Knowing the period and the fact that it's reflected helps to determine the value of 'a' and thus the amplitude.
What is the process to graph the function y = 3 * sin(3x)?
-First, find the new period by dividing the original period of sine (2π) by the coefficient of 'x' (3), resulting in a period of 2π/3. Identify any vertical shifts (none in this case). Mark the x-intercepts for sine at the ends and center of the period. Determine the key points at the quarters, which for the original sine function are (π/6, 1) and (5π/6, -1). Multiply these by the amplitude, which is 3 in this case, to get the new key points.
Outlines
📈 Introduction to Graphing Sine and Cosine Transformations
The video begins with an introduction to graphing sine and cosine functions with transformations. It emphasizes the importance of understanding how to adjust the period of these trigonometric functions and hints at covering tangent, cotangent, secant, and cosecant in subsequent lessons. The presenter outlines the steps for graphing these functions, including identifying the period, amplitude, and phase shift, and assures viewers that following these steps will yield accurate graphs.
🔍 Understanding the Period and Key Points of Sine and Cosine
The presenter delves into the specifics of finding the period of sine and cosine functions by dividing 2π by the coefficient of x (referred to as omega). It is clarified that tangent functions have a period of π over omega. The process of identifying vertical shifts, x-intercepts, and key points for both sine and cosine functions is explained. The role of the amplitude 'a' in reflecting the graph and stretching or compressing it is also discussed.
📉 Applying the Steps to Graph y=3sin(x)
The video demonstrates how to apply the discussed steps to graph the function y=3sin(x). It shows that the period of the sine function is 2π divided by the coefficient of x, which is 1 in this case. The amplitude is then described as a factor that affects the output of the sine function, leading to a vertical stretch or compression. The process of plotting key points and extending the graph for multiple cycles is also covered.
🔄 Graphing y=-4cos(x) and Understanding Cosine Transformations
The presenter moves on to graph y=-4cos(x), starting with identifying the period as 2π and then explaining how the negative coefficient results in a vertical reflection and stretch of the cosine function. The importance of plotting the period, vertical shift (if any), and key points is reiterated. The concept of x-intercepts for cosine functions is also explained, noting their positions at the quarters of the period.
🔃 Horizontal Compression with Sine Function
The video explores the concept of horizontal compression in the context of the sine function, specifically with the function sine(3x). It explains how the coefficient of x affects the period, causing the graph to compress horizontally. The presenter shows how to calculate the new period (2π/3) and how to plot the key points and x-intercepts based on this adjusted period.
🤔 Dealing with Negative Coefficients and Even/Odd Functions
The presenter clarifies a common misconception about handling negative coefficients within trigonometric functions. It explains the properties of odd and even functions, noting that sine is an odd function and cosine is an even function. This characteristic allows for the conversion of negative coefficients into positive ones by reflecting the function. The video also emphasizes not to factor out a negative coefficient incorrectly.
📐 Graphing Cosine Functions with Horizontal Compression
The video continues with graphing cosine functions, specifically focusing on cosine(2x). It outlines the process of determining the period (π in this case) and emphasizes the importance of plotting the period and key points after any vertical shifts. The concept of x-intercepts at the quarters for cosine functions is also discussed, along with how to adjust these points based on the function's amplitude.
🔢 Finding the Function from a Given Period and Amplitude
The presenter concludes with a discussion on deriving a trigonometric function from a given period and amplitude. It explains how to calculate the coefficient (omega) based on the period and how to incorporate the amplitude into the function. The video also touches on the possibility of inferring a function from a graph, encouraging viewers to practice these skills to gain a deeper understanding of trigonometric graphing.
Mindmap
Keywords
💡Trigonometric Functions
💡Period
💡Amplitude
💡Phase Shift
💡Vertical Shift
💡Sine Function
💡Cosine Function
💡Key Points
💡Horizontal Compression
💡Reflection
💡Odd and Even Functions
Highlights
The video explains how to graph sine and cosine functions with transformations, focusing on period adjustments.
Multiplying inside the argument of trigonometric functions adjusts the period, causing horizontal stretch or compression.
The amplitude of a function is affected by multiplying the function itself, not the argument.
Phase shifts are horizontal transformations to the left or right, opposite to what's in the parenthesis.
The video outlines a four-step process for graphing trigonometric functions, which includes finding the period, identifying vertical shifts, marking x-intercepts, and plotting key points.
The amplitude, represented by the letter 'a', can cause stretching or compression and reflection if it's negative.
For the sine function, x-intercepts occur at the ends and center of the period, while for cosine, they occur at the quarters.
The process of graphing involves identifying the period, any vertical shifts, and then plotting key points based on the function's characteristics.
When graphing sine or cosine functions, it's crucial to first determine the period and then adjust for any phase shifts or vertical shifts.
The video demonstrates how to handle negative coefficients in the argument of trigonometric functions using the properties of odd and even functions.
For cosine functions, key points are determined by the function's peaks and valleys, which occur at different intervals than sine functions.
The concept of vertical shifts is introduced as adding or subtracting from the output of the function, affecting the graph's position on the y-axis.
The video provides a method for graphing trigonometric functions that emphasizes understanding the relationship between the function, its period, and any transformations.
Key points for sine and cosine functions are identified based on their position relative to the period and are then adjusted for amplitude and reflection.
The process of graphing includes plotting key points after considering the effects of horizontal compression or stretch and vertical shifts or reflections.
The video concludes with a discussion on how to create a trigonometric function from given properties such as amplitude or period.
Transcripts
Browse More Related Video
How to Graph Phase Shifts of Trigonometric Functions (Precalculus - Trigonometry 16)

Graphing Transformations with Tangent and Cotangent (Precalculus - Trigonometry 14)
Graphing Sine and Cosine Trig Functions With Transformations, Phase Shifts, Period - Domain & Range
Graphing Trigonometric Functions, Phase Shift, Period, Transformations, Tangent, Cosecant, Cosine

How to Graph Cosecant and Secant (Precalculus - Trigonometry 15)
How To Graph Trigonometric Functions | Trigonometry
5.0 / 5 (0 votes)
Thanks for rating: