Transformations of Functions | Precalculus
TLDRThis video script delves into the concept of function transformations, illustrating how to manipulate graphs of functions through various mathematical operations. It explains vertical and horizontal shifts, reflections over the x-axis, y-axis, and origin, and discusses vertical and horizontal stretches and shrinks. The script provides examples using parent functions like x squared and square root of x, demonstrating how to apply transformations to create new function graphs. It also guides viewers on how to graph functions like x minus 2 squared plus three and 4 minus the square root of 3 minus x, using a combination of shifts, reflections, and stretches to visualize the transformed graphs.
Takeaways
- 📈 Adding a constant to a function f(x) results in a vertical shift of the graph; adding 2 moves it up 2 units, while subtracting 3 moves it down 3 units.
- 🔄 Subtracting a constant inside the function (e.g., f(x-3)) results in a horizontal shift to the right; the graph moves right by the value of the constant.
- 🔄 Adding a constant inside the function (e.g., f(x+3)) results in a horizontal shift to the left; the graph moves left by the absolute value of the constant.
- 🔄 A negative sign outside the function reflects it over the x-axis, while a negative sign inside reflects it over the y-axis. Both result in a reflection over the origin.
- 📏 Multiplying the function by a constant (e.g., 2f(x)) results in a vertical stretch, doubling the y-values.
- 📏 Dividing the function by a constant (e.g., f(x)/2) results in a vertical shrink, halving the y-values.
- 📏 Multiplying by a constant inside the function (e.g., f(2x)) results in a horizontal shrink, reducing the x-values by half.
- 📏 Dividing inside the function by a constant (e.g., f(1/2x)) results in a horizontal stretch, increasing the x-values by a factor of two.
- 📚 Understanding the parent functions such as y=x, y=x^2, y=x^3, y=√x, and y=|x| is crucial for graphing transformations.
- 📈 To graph a transformed function, identify the shifts, stretches, and reflections, then apply them to the parent function to create the new graph.
Q & A
What is a vertical shift in the context of function transformations?
-A vertical shift refers to moving the graph of a function up or down along the y-axis. If you add a positive number to the function, the graph moves up by that number of units. Conversely, if you subtract a positive number, the graph moves down by that number of units.
How does the transformation f(x) - 4 affect the graph of a function?
-The transformation f(x) - 4 results in a horizontal shift of the graph to the right by 4 units. This is because setting the inside of the function equal to zero (x - 4 = 0) gives x = 4, indicating the shift to the right.
What happens to the graph of a function when a negative sign is placed in front of f(x)?
-Placing a negative sign in front of f(x) results in a reflection of the graph over the x-axis. This means that the entire graph is mirrored horizontally, inverting the y-values while keeping the x-values the same.
Can you explain the effect of multiplying f(x) by a fraction?
-Multiplying f(x) by a fraction causes a vertical shrink of the graph. This means that the y-values of the graph are reduced to the fraction of their original size, making the graph appear 'smaller' vertically.
What is the difference between a horizontal shrink and a horizontal stretch when modifying the input of a function?
-A horizontal shrink occurs when a number greater than 1 is multiplied by the input inside the function (e.g., 2x), which reduces the x-values needed to achieve the same y-value. A horizontal stretch happens when a fraction less than 1 is used (e.g., 1/2x), which increases the x-values needed for the same y-value.
How does the absolute value function |x| transform when x is replaced with x + 2?
-When x is replaced with x + 2 in the absolute value function |x|, the graph shifts two units to the left. This is because the original point at x = 0 is now at x = -2, and the entire graph follows this shift.
What is the effect of adding 3 to the function y = x^2?
-Adding 3 to the function y = x^2 results in a vertical shift of the graph up by 3 units. The new graph will start at the point (0, 3) instead of the origin (0, 0).
Can you describe the process of graphing the function y = √(2x)?
-To graph y = √(2x), first identify the parent function y = √x and its graph. Then, recognize that the 2 inside the square root causes a horizontal shrink by a factor of 2, meaning the x-values are halved for the same y-values. The graph will be narrower, with the same y-values occurring at double the x-values of the parent function.
How does the graph of y = √(x) change when it becomes y = -√(-x)?
-The graph of y = √(x) changes in two ways when it becomes y = -√(-x). First, the negative sign outside the square root reflects the graph over the x-axis. Second, the negative sign inside the square root reflects the graph over the y-axis, which is equivalent to a reflection over the origin, sending the graph towards quadrants where x and y have opposite signs.
What are the steps to graph the function y = x - 2 squared plus three using transformations?
-To graph y = (x - 2)^2 + 3, first identify the parent function y = x^2. Then, apply the horizontal shift to the right by 2 units (due to x - 2) and the vertical shift up by 3 units. Sketch the transformed parabola starting from the new vertex at (2, 3).
How can you determine the direction of the graph for y = 4 - √(3 - x)?
-To determine the direction of the graph for y = 4 - √(3 - x), consider the transformations. The negative sign inside the square root indicates a horizontal shift to the right by 3 units (since 3 - x = 0 gives x = 3). The negative sign outside the square root and the subtraction in front of the square root suggest reflections over both the x-axis and y-axis, sending the graph towards quadrant three.
Outlines
📈 Understanding Function Transformations
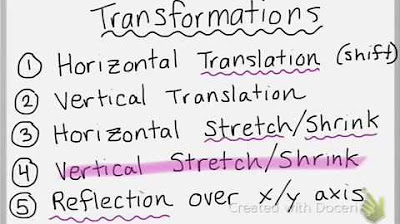
This paragraph introduces the concept of function transformations, focusing on how adding or subtracting from a function affects its graph. It explains vertical shifts (up or down) and horizontal shifts (left or right), using examples like f(x) + 2, x - 3, f(x) - 4, and x - 4. The paragraph also covers reflections over the x-axis, y-axis, and origin, as well as vertical stretches and shrinks, and horizontal shrinks and stretches. The importance of understanding these transformations is emphasized through examples of parent functions like f(x) = x^2 and transformations applied to them.
📚 Examples of Function Graphs and Transformations
The second paragraph delves into examples of graphing transformations, starting with the parent function y = x^2 and its variations like x^2 + 3 and x^2 - 2. It then moves on to discuss absolute value functions and their shifts, such as y = |x + 2| and y = |x - 3|, and how they affect the graph's position. The paragraph also explains how to graph square root functions and their transformations, like y = √x and y = -√x, including reflections over the x-axis and y-axis.
📉 Graphing Quadrants and Transformations
This paragraph discusses how to determine the direction of graph transformations based on the signs of x and y in different quadrants. It provides a method to remember which direction the graph will move by considering the signs of x and y and their corresponding quadrants. The paragraph then gives examples of graphing absolute value functions and their transformations, such as 2| x | and 1/2 | x |, to illustrate vertical stretches and shrinks. It emphasizes the importance of comparing x values for the same y value to distinguish between horizontal and vertical transformations.
📊 Parent Functions and Their Transformed Graphs
The fourth paragraph provides a brief overview of key parent functions such as y = x, y = x^2, y = x^3, y = √x, y = ∛x, and y = |x|. It then demonstrates how to graph transformed functions using these parent functions as a reference. Examples include x - 2^2 + 3, which involves a horizontal shift to the right and a vertical shift up, and 3 - x + 2^2, which has a vertical shift up and a horizontal shift to the left. The paragraph explains how to determine the direction of the parabola's opening and how to plot points accurately to sketch the graph.
🔍 Accurate Graphing Techniques and Examples
The final paragraph focuses on accurate graphing techniques, providing a step-by-step guide on how to graph functions like y = 4 - √(3 - x) by first rewriting the equation to identify transformations. It explains how to determine horizontal shifts by setting the inside of the function to zero and solving for x. The paragraph also covers how to reflect graphs over the x-axis and y-axis, and how to combine these reflections to reflect over the origin. It concludes with examples of plotting points and sketching the graph, ensuring that the x and y values are consistent with the transformations applied.
Mindmap
Keywords
💡Vertical Shift
💡Horizontal Shift
💡Reflection
💡Vertical Stretch
💡Vertical Shrink
💡Horizontal Shrink
💡Parent Function
💡Transformation
💡Graph Sketching
💡Absolute Value
Highlights
Introduction to the topic of function transformations.
Explanation of vertical shifts with the function f(x) + 2, resulting in an upward movement of the graph.
Vertical shift down with x - 3, moving the graph down 3 units.
Horizontal shift to the right with f(x) - 4, shifting the graph 4 units to the right.
Horizontal shift to the left with f(x) + 3, shifting the graph 3 units to the left.
Reflections over the x-axis with a negative sign outside the function.
Reflections over the y-axis with a negative sign inside the function.
Reflection over the origin with negative signs both inside and outside the function.
Vertical stretch with a factor of 2 in front of f(x).
Vertical shrink with a fraction in front of f(x).
Horizontal shrink with a factor of 2 inside the function.
Horizontal stretch with a factor of 1/2 inside the function.
Graphing examples with transformations of the parent function f(x) = x^2.
Transformation of the absolute value function and its effect on the graph.
Graphing the square root function and its transformations.
Understanding reflections and quadrants based on the signs of x and y.
Graphing transformations using points for the absolute value and stretched/shrunk functions.
Graphing horizontal and vertical stretches and shrinks with examples.
Using parent functions as a reference for graphing transformations.
Graphing complex functions using transformations and accurate plotting.
Technique for graphing without making a table for accurate sketches.
Final example of graphing a function with a combination of transformations.
Transcripts
Browse More Related Video
Introduction to Transformations of Functions
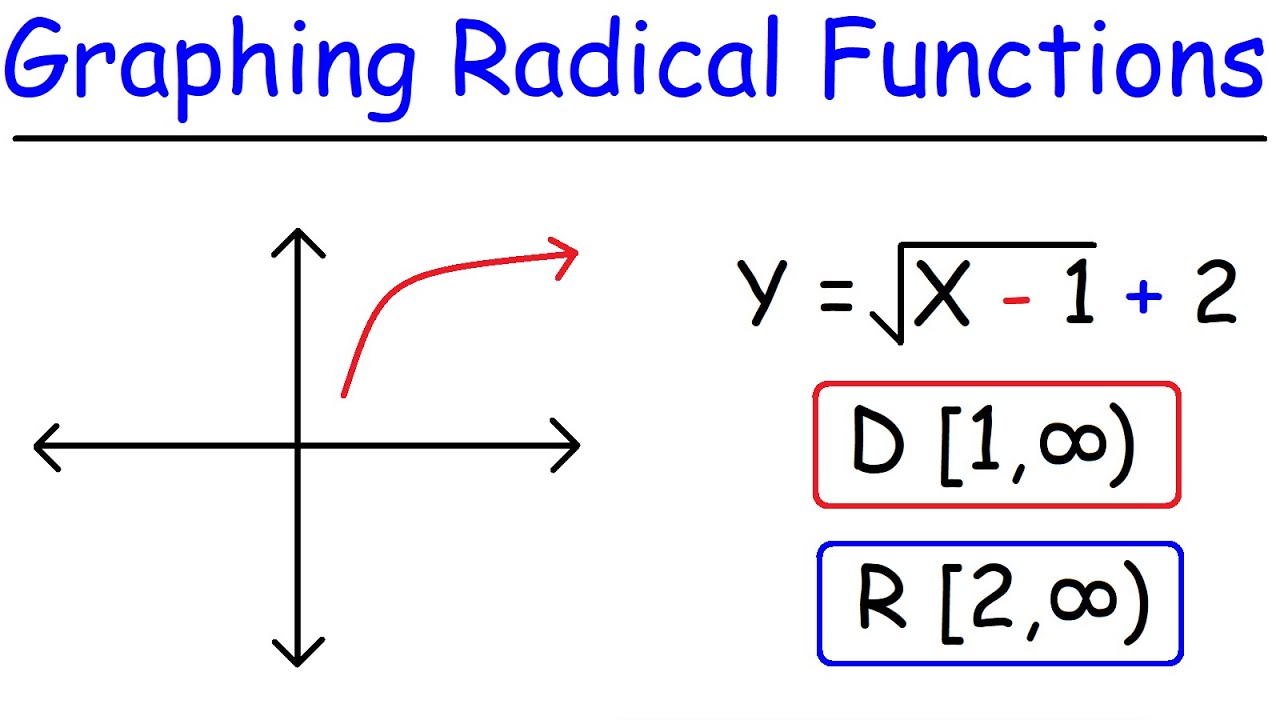
How To Graph Radical Functions & Determine The Domain and Range
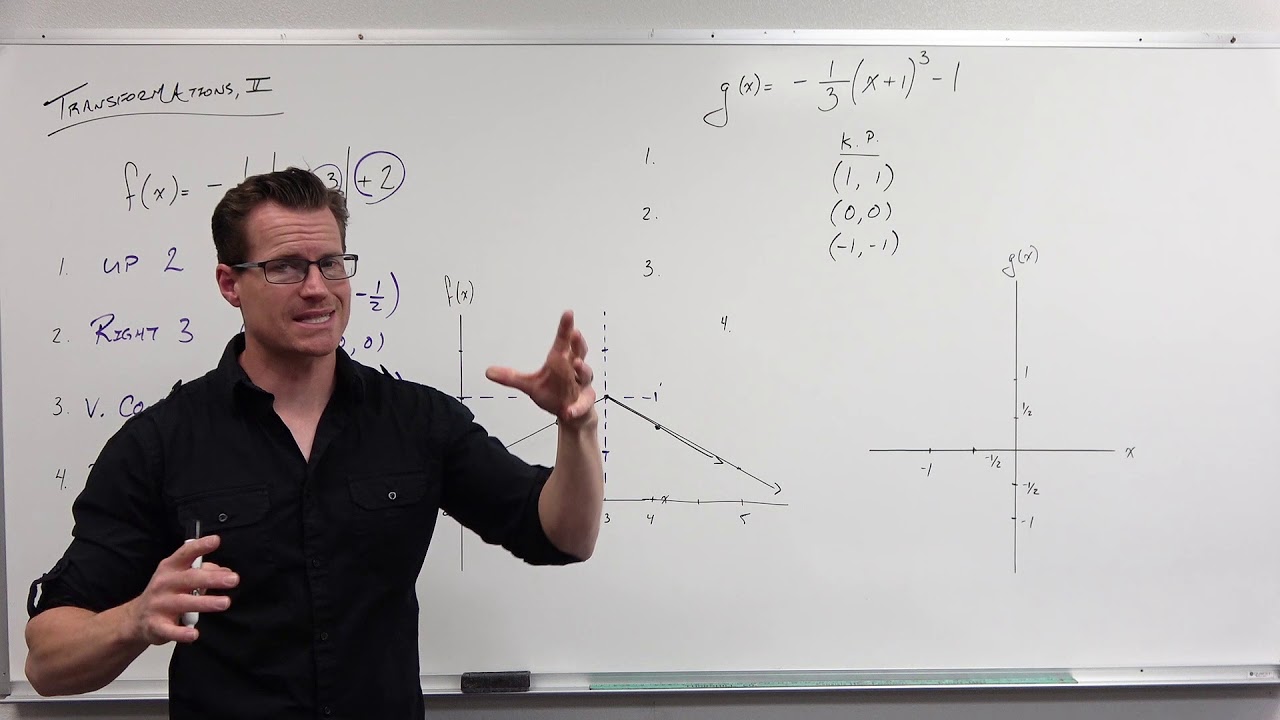
How to Graph with Transformations (Precalculus - College Algebra 15)
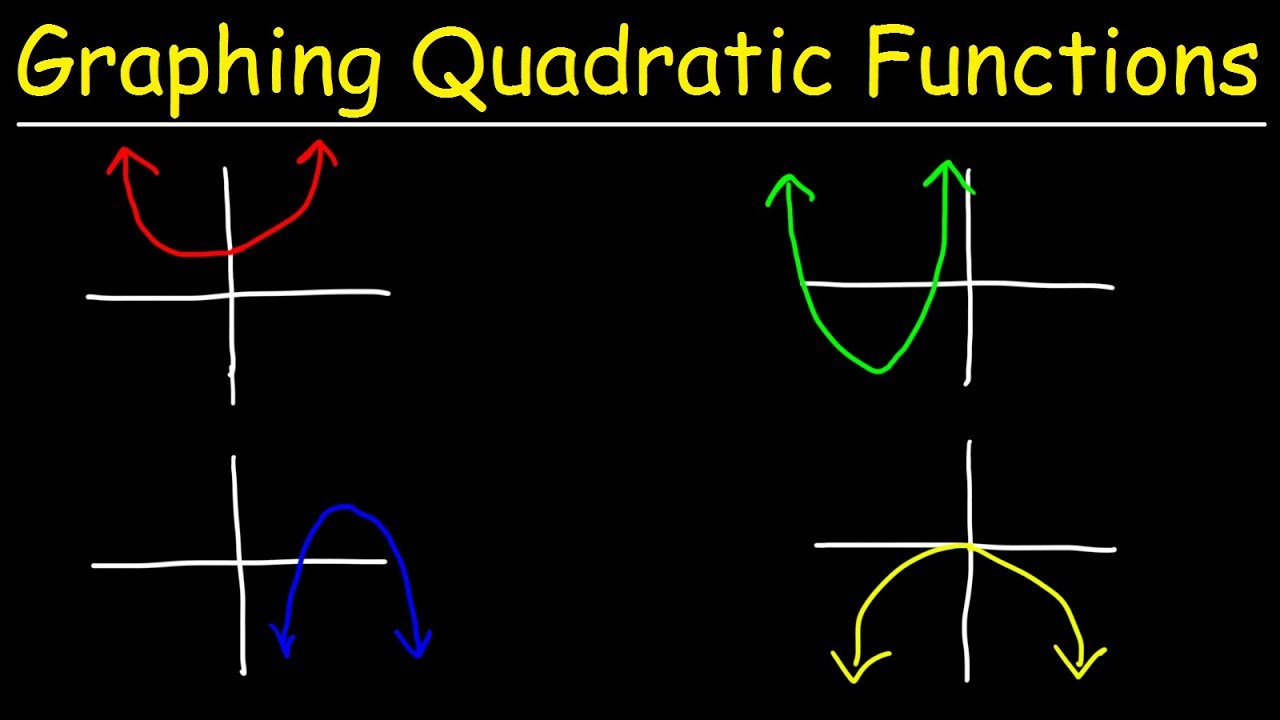
Graphing Quadratic Functions Using Transformations
Graphing Transformations with Sine and Cosine (Precalculus - Trigonometry 12)

Graphing Rational Functions with Transformations (Precalculus - College Algebra 39)
5.0 / 5 (0 votes)
Thanks for rating: