Normal Distribution EXPLAINED with Examples
TLDRThe video by Mark from Ace Tutors explains the concept of the normal distribution, its significance in statistics, and how it's applied in real-world scenarios. It covers the basics of the bell curve, the importance of mean and standard deviation, and the process of standardizing data using z-scores. The video also demonstrates how to calculate probabilities using z-charts and provides a practical example involving pizza sizes and their distribution, illustrating the calculation of probabilities for different scenarios.
Takeaways
- 📊 The normal distribution is a symmetric bell curve centered around the mean, with probabilities decreasing as you move away from the mean in either direction.
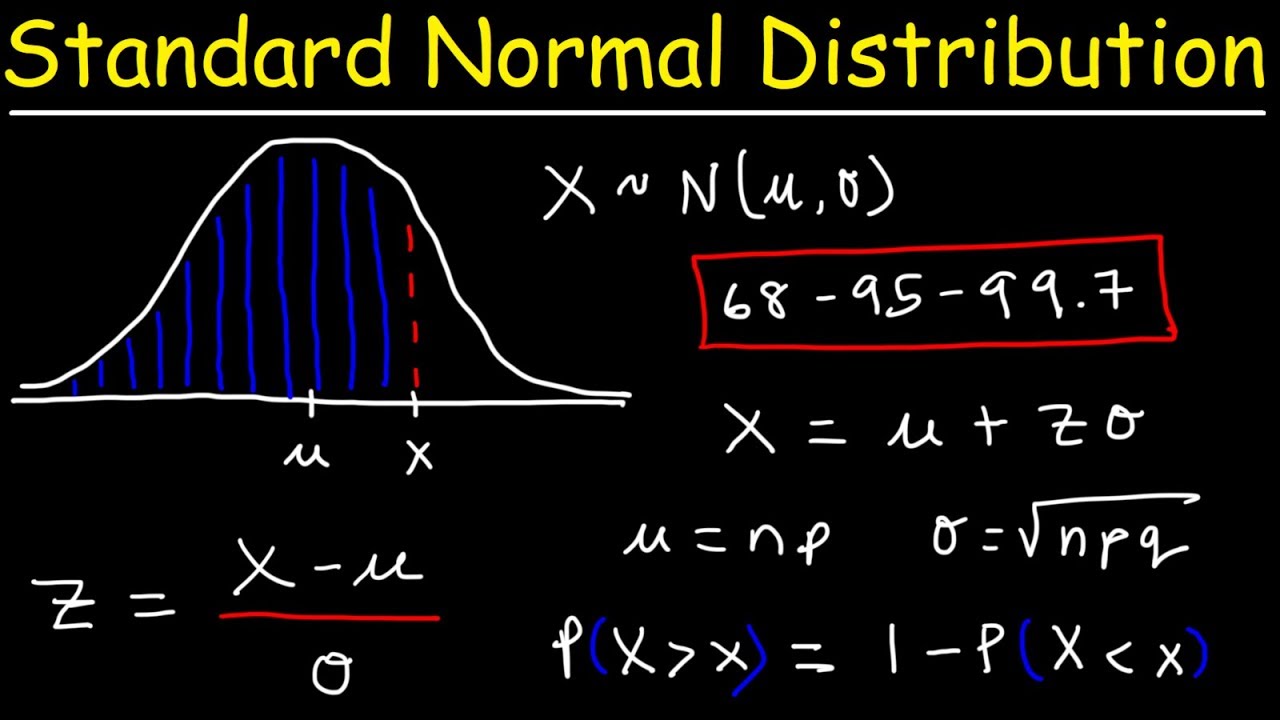
- 📈 In a normal distribution, approximately 68% of the data lies within one standard deviation of the mean, 95% within two, and 99.7% within three standard deviations.
- 🌟 The normal distribution is widely applicable in real-world applications, such as measuring human heights, weights, and IQs.
- 🔄 To standardize data, the original units are removed by transforming the distribution to have a mean of 0 and a standard deviation of 1.
- 📐 The z-score (x - μ) / σ is used to measure how many standard deviations a data point is from the mean in a standardized distribution.
- 📊 Understanding z-scores allows us to locate a data point's position in a standardized normal distribution.
- 🎯 Probability values for a normal distribution are determined using z-scores and probability charts, which provide the area to the left of a given z-score.
- 🔢 For positive and negative z-scores, different charts are used to find the associated probabilities, with the left chart for negative scores and the right for positive scores.
- 🍕 An example in the script involves calculating probabilities related to pizza sizes and their standard deviation to determine the likelihood of getting a free pizza or one within a certain size range.
- 📝 When calculating probabilities for a range, z-scores for the upper and lower bounds are found and used to determine the area between them on the probability chart.
- 💡 The video aims to educate viewers on the concept and application of normal distribution and standardization in统计学, encouraging engagement and feedback for continuous improvement.
Q & A
What is the normal distribution also known as?
-The normal distribution is also known as the bell curve due to its symmetric bell-shaped appearance.
What are the key characteristics of the normal distribution?
-The normal distribution is characterized by its symmetry around the mean, with probabilities decreasing as one moves away from the mean in either direction. Most of the data (68%) lies within one standard deviation of the mean, 95% within two standard deviations, and 99.7% within three standard deviations.
Why is the normal distribution significant in statistics?
-The normal distribution is significant because it can model many real-world phenomena, such as people's heights, weights, and IQ scores. Its wide applicability makes it a fundamental concept in statistical analysis.
What is standardizing data in the context of normal distribution?
-Standardizing data refers to the process of transforming the original data to have a mean of 0 and a standard deviation of 1. This process removes the units and allows any normal distribution to be compared on a standardized scale, making it easier to analyze and compare different datasets.
What is a z-score and how is it calculated?
-A z-score represents the number of standard deviations a data point is away from the mean. It is calculated using the formula: z = (x - μ) / σ, where x is the data point, μ is the mean, and σ is the standard deviation.
How are probabilities calculated for the normal distribution?
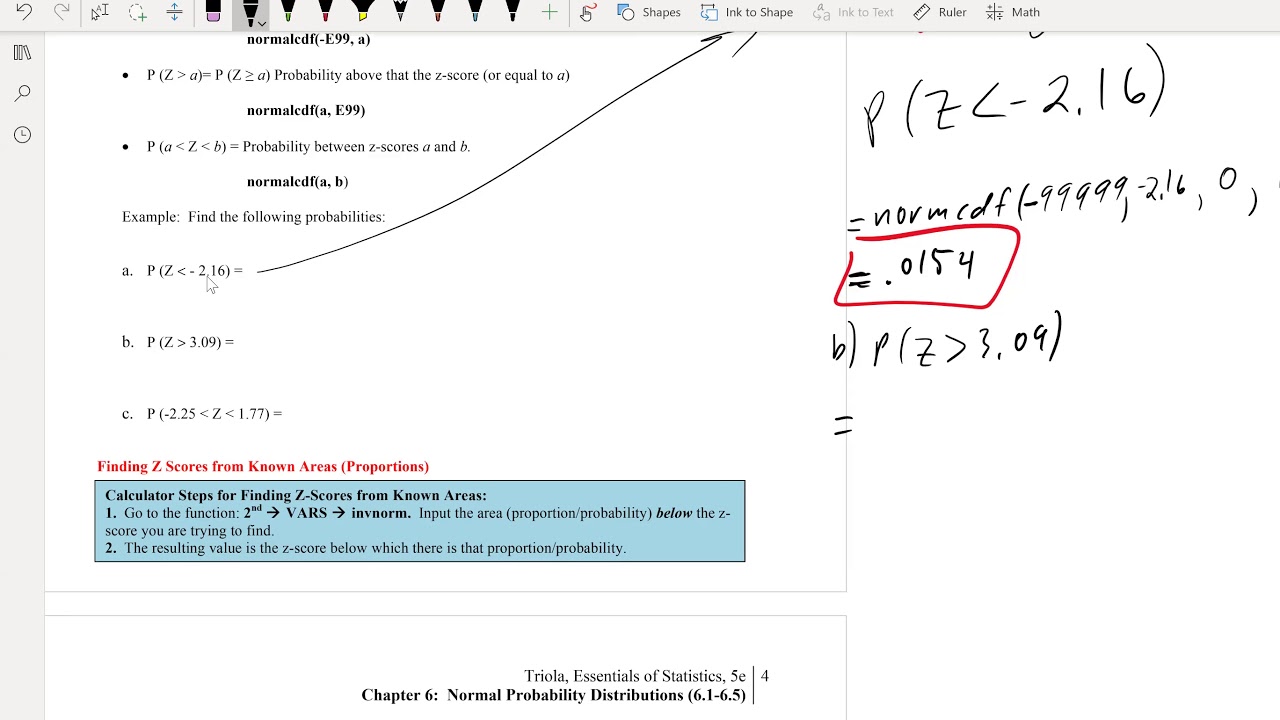
-Probabilities for the normal distribution are calculated using z-scores and reference charts. These charts provide the area or probability associated with a specific z-score, which can be used to determine the likelihood of a data point falling within a certain range.
What does a z-chart provide and how is it used?
-A z-chart provides the area or probability of being to the left of a given z-score. It is used to find the likelihood of a data point falling below a specific z-score value, which helps in determining probabilities for various scenarios within the context of the normal distribution.
How can you find the probability of a data point being within a specific range in a normal distribution?
-To find the probability of a data point falling within a specific range, you first calculate the z-scores for the endpoints of that range. Then, using the z-charts, you find the associated probabilities for each z-score and subtract the smaller probability from the larger one to get the probability of the data point falling between the two z-scores.
What is the probability of getting a free pizza if the local pizza shop claims their large pizza is at least 16 inches?
-The probability of getting a free pizza is 6.68%. This is calculated by standardizing the data point of 16 inches (the claim) and finding the associated probability in the z-chart, which represents the chance of getting a pizza smaller than the claimed size.
What is the probability of getting a pizza larger than 16.5 inches?
-The probability of getting a pizza larger than 16.5 inches is 15.87%. This is found by calculating the z-score for 16.5 inches and using the z-chart to find the probability of a z-score higher than the calculated value, and then subtracting it from 1 to find the probability to the right of the z-score.
What is the probability of getting a pizza with a size between 15.95 inches and 16.63 inches?
-The probability of getting a pizza with a size between 15.95 inches and 16.63 inches is 91.04%. This is calculated by finding the z-scores for both endpoints and using the z-charts to determine the probabilities associated with those z-scores, then subtracting the smaller probability from the larger one to find the probability of the data point falling within that range.
Outlines
📊 Introduction to Normal Distribution
This paragraph introduces the concept of the normal distribution, a common probability distribution in statistics. It explains the bell curve shape, centered around the mean, with probabilities decreasing as one moves away from the mean. The significance of the normal distribution is highlighted by its wide applicability in real-world data, such as people's heights, weights, and IQ scores. The paragraph also touches on the challenges of using the normal distribution due to its dependence on specific mean, standard deviation, and units. To overcome this, the concept of standardizing data is introduced, which involves transforming the original distribution to have a mean of 0 and a standard deviation of 1, facilitating easier comparison across different datasets.
📐 Understanding Z-Scores and Probability
This paragraph delves into the specifics of how to standardize data points using z-scores, which measure the number of standard deviations a data point is from the mean. The z-score formula is provided, and its application in the context of a normal distribution is explained. The paragraph further discusses the use of z-score charts to calculate probabilities associated with specific z-scores. It clarifies that these charts provide the probability of a value being to the left of the given z-score for both negative and positive values. The explanation includes an example of how to interpret the chart values and the importance of using the correct chart based on the z-score's sign.
🍕 Pizza Probability Scenarios
The final paragraph presents a practical example involving the probability of getting a free pizza from a local shop based on the size of the pizza. It uses the normal distribution to calculate the likelihood of various outcomes: getting a free pizza for a size less than 16 inches, getting a larger pizza over 16.5 inches, and getting a pizza within a specific size range between 15.95 and 16.63 inches. The example illustrates the process of standardizing data points to z-scores and using them to find probabilities from the z-score charts. The explanation is detailed, showing the step-by-step calculations and the final probabilities for each scenario, providing a clear demonstration of how to apply the concepts of normal distribution and z-scores in real-life situations.
Mindmap
Keywords
💡Normal Distribution
💡Mean
💡Standard Deviation
💡Z-Score
💡Probability
💡Symmetrical
💡Data Standardization
💡Probability Chart
💡Statistical Analysis
💡Empirical Rule
Highlights
Mark from Ace Tutors introduces the concept of the normal distribution, a fundamental topic in statistics.
The normal distribution, also known as the bell curve, is symmetric and centered around the mean.
As you move away from the mean in either direction, the probability decreases following the bell curve.
The majority of the data in a normal distribution lies within three standard deviations from the mean.
68% of the data is found within one standard deviation of the mean, 95% within two, and 99.7% within three.
Normal distribution is widely applicable in real-world scenarios, such as people's heights and weights.
To address issues with different units, normal distribution data is standardized by transforming it to have a mean of 0 and a standard deviation of 1.
Standardizing involves calculating the z-score, which is the number of standard deviations a data point is from the mean.
The z-score formula is z = (x - μ) / σ, where x is the data point, μ is the mean, and σ is the standard deviation.
Probability charts are used to determine probabilities for the normal distribution, as there is no direct formula.
Z-charts provide the area or probability to the left of a z-score, which is crucial for understanding probabilities.
Different charts are used for negative or positive z-scores to accurately determine probabilities.
Mark provides a practical example involving pizza sizes and their distribution to illustrate the application of normal distribution.
The mean pizza size is 16.3 inches with a standard deviation of 0.2 inches, based on the example.
The probability of getting a free pizza (less than 16 inches) is calculated using the z-score and corresponding probability from the chart.
To find the probability of a pizza being over 16.5 inches, one must calculate the z-score and use the chart to find the area to the right of the z-score.
The probability of a pizza being between 15.95 and 16.63 inches is determined by finding the z-scores for these sizes and calculating the area between them.
Mark encourages viewers to subscribe for more educational content and provides a platform for feedback to improve future videos.
Transcripts
Browse More Related Video

Elementary Statistics - Chapter 6 Normal Probability Distributions Part 1
Standard Normal Distribution Tables, Z Scores, Probability & Empirical Rule - Stats

Elementary Stats Lesson #11
ck12.org normal distribution problems: z-score | Probability and Statistics | Khan Academy
Math 119 Chap 6 part 1
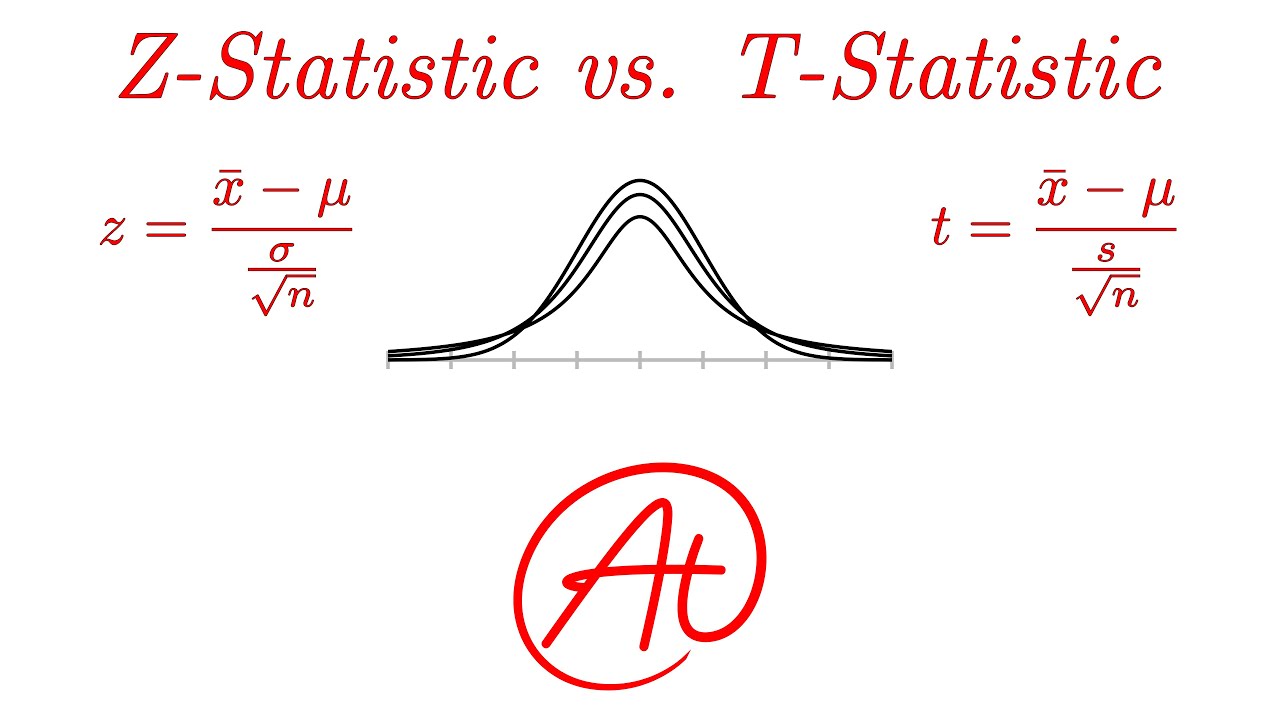
Z-Statistics vs. T-Statistics EXPLAINED in 4 Minutes
5.0 / 5 (0 votes)
Thanks for rating: