Statistics - How to use Chebyshev's Theorem
TLDRThis video tutorial introduces Chebyshev's theorem, a mathematical tool for estimating the proportion of data within K standard deviations of the mean, applicable to any distribution. The presenter uses two examples to illustrate the theorem's application: one with a set of 30 data points to find the percentage within two standard deviations, and another with car prices to determine the minimum percentage of vehicles sold within a specific price range. The video demonstrates how Chebyshev's theorem provides a quick, lower-bound estimate, which is then compared to actual data percentages, showing its practical utility in data analysis.
Takeaways
- 📚 Chebyshev's theorem is a mathematical principle that provides a way to estimate the proportion of data within a certain number of standard deviations from the mean.
- 🔍 The theorem is applicable to any distribution of data, not just normal distributions, making it a versatile tool for statistical analysis.
- 📉 Chebyshev's formula gives a lower bound for the proportion of data within K standard deviations of the mean, meaning the actual percentage could be higher.
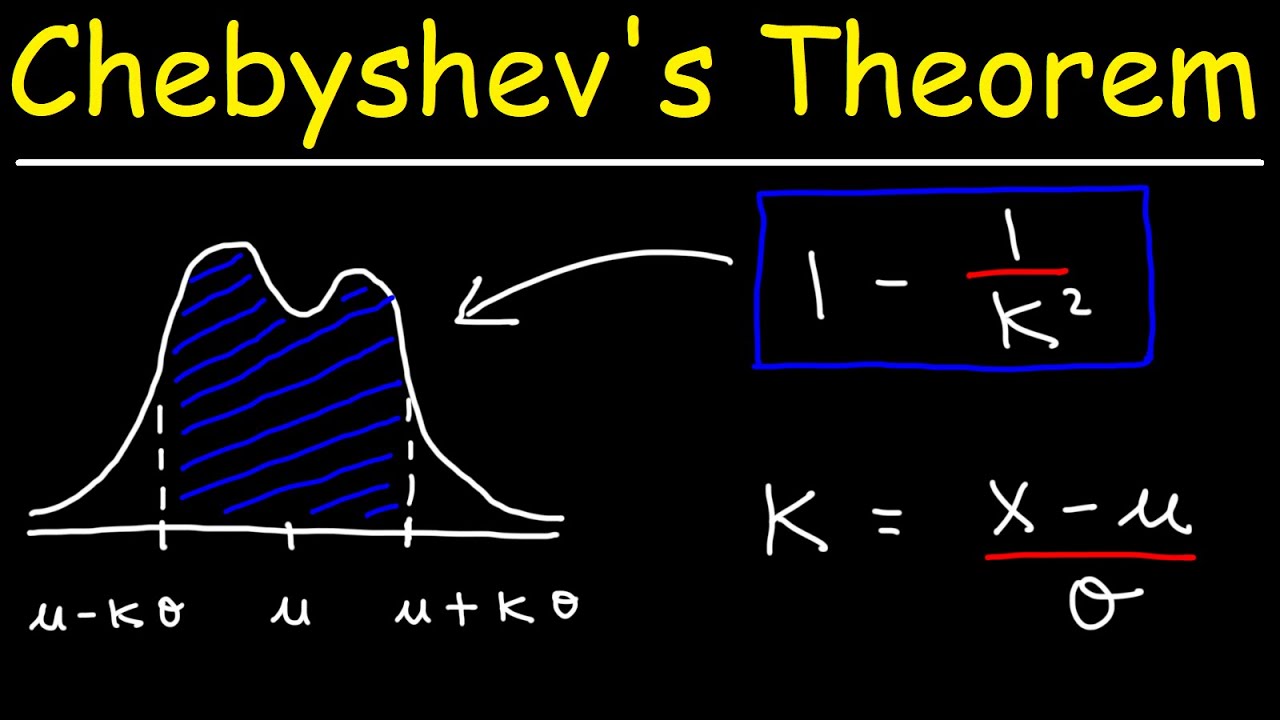
- 📝 The formula for Chebyshev's theorem is \( 1 - \frac{1}{K^2} \), where K is the number of standard deviations.
- 🧮 The video demonstrates the use of Chebyshev's theorem with an example involving 30 data points and the calculation of the proportion within two standard deviations.
- 📊 The example shows that using Chebyshev's theorem, one can quickly estimate that at least 75% of the data falls within two standard deviations of the mean.
- ⚖️ The actual proportion of data within two standard deviations is calculated by finding the mean and standard deviation, then determining the range.
- 📈 In the example given, the actual percentage of data within two standard deviations was found to be 93.3%, exceeding the lower bound provided by Chebyshev's theorem.
- 🚗 Another example provided in the script relates to the average price of a new car, using Chebyshev's theorem to estimate the minimum percentage of cars selling within a specific price range.
- 💰 The car price example involves calculating the 'K' value for the given price range and using it in Chebyshev's formula to estimate a minimum of 91.3% of cars selling within the range.
- 🔗 The video concludes by encouraging viewers to visit the website for more educational content, indicating a resource for further learning.
Q & A
What is Chebyshev's theorem?
-Chebyshev's theorem provides the minimum proportion of data that lies within K standard deviations of the mean, regardless of the distribution of the data.
What does Chebyshev's theorem guarantee about the data distribution?
-Chebyshev's theorem guarantees that at least a certain percentage of the data will fall within K standard deviations of the mean, providing a lower bound for this proportion.
Can Chebyshev's theorem be applied to any type of data distribution?
-Yes, Chebyshev's theorem can be applied to any data distribution, not just normal distributions.
What is the minimum percentage of data that Chebyshev's theorem states should fall within two standard deviations of the mean?
-Chebyshev's theorem states that at least 75% of the data should fall within two standard deviations of the mean.
How does the script calculate the mean and standard deviation for the data set?
-The script uses a calculator to compute the mean and standard deviation of the data set, which are essential for applying Chebyshev's theorem.
What is the mean and standard deviation of the data set used in the script's first example?
-The mean of the data set is approximately 36.1, and the sample standard deviation is approximately 12.8.
How does the script determine the range of values within two standard deviations of the mean?
-The script subtracts and adds two times the standard deviation from the mean to find the lower and upper bounds of the range.
What percentage of the data in the script's first example falls within two standard deviations of the mean?
-In the script's first example, 93.3% of the data falls within two standard deviations of the mean.
How does the script compare Chebyshev's theorem to the actual percentage of data within two standard deviations?
-The script shows that while Chebyshev's theorem guarantees at least 75% of the data falls within two standard deviations, the actual percentage found in the example is higher, at 93.3%.
What is the context of the second example provided in the script?
-The second example involves determining the minimum percentage of new cars that should sell within a certain price range, given the average price and standard deviation of new car prices.
How does the script use Chebyshev's theorem to find the minimum percentage of cars selling within a specific price range?
-The script calculates the number of standard deviations that correspond to the price range and then applies Chebyshev's theorem to estimate the minimum percentage of cars that should fall within that range.
What is the estimated minimum percentage of cars that should sell within the given price range according to Chebyshev's theorem?
-According to Chebyshev's theorem, at least 91.3% of cars should sell within the specified price range.
Outlines
📚 Introduction to Chebyshev's Theorem
This paragraph introduces Chebyshev's theorem, a statistical concept that provides a lower bound for the proportion of data within K standard deviations of the mean. It explains that the theorem can be applied to any distribution and is useful for estimating the percentage of data that falls within a certain range. The video script discusses the theorem's application to a set of 30 data points, using the theorem to predict that at least 75% of the data falls within two standard deviations of the mean. The actual calculation of the mean and standard deviation is shown, followed by an analysis of the data to confirm that 93.3% of the data points fall within the expected range, which is higher than the theorem's lower bound.
🚗 Applying Chebyshev's Theorem to Car Prices
The second paragraph demonstrates the application of Chebyshev's theorem to a real-world scenario involving the average price of a new car. With an average price of $36,000 and a standard deviation of $4,100, the script calculates the minimum percentage of cars that should sell within a range of $22,000 to $50,000. The process involves determining the 'K' value, which represents the number of standard deviations that span the given price range. By solving for 'K' and applying Chebyshev's formula, the video concludes that at least 91.3% of cars should fall within the specified price range. The explanation emphasizes the practical use of the theorem for estimating proportions in various contexts.
Mindmap
Keywords
💡Chebyshev's Theorem
💡Standard Deviation
💡Mean
💡Data Distribution
💡Percentage
💡K Standard Deviations
💡Calculator
💡Proportion
💡Ballpark Answer
💡Example
Highlights
Introduction to Chebyshev's theorem and its application in determining data proportions within standard deviations.
Chebyshev's theorem provides a minimum percentage of data within K standard deviations of the mean, applicable to any distribution.
The theorem offers a quick formula to estimate the proportion of data, though it may be more than the calculated value.
Demonstration of Chebyshev's theorem with an example involving 30 data points and calculating the proportion within two standard deviations.
Calculation of the mean and standard deviation as a prerequisite for applying Chebyshev's theorem.
Use of a calculator to expedite the process of finding the mean and standard deviation of a large dataset.
Determination of the range of values within two standard deviations of the mean for a dataset.
Comparison of Chebyshev's theorem's prediction with the actual proportion of data within two standard deviations.
Finding that 93.3% of the data falls within two standard deviations, exceeding the theorem's minimum estimate of 75%.
Introduction of a second example involving the average price of a new car and its standard deviation.
Objective to find the minimum percentage of cars selling within a specific price range using Chebyshev's theorem.
Visual representation of the data distribution and the target price range in relation to the mean.
Calculation of the K value required for Chebyshev's formula based on the given price range.
Application of Chebyshev's theorem to estimate the minimum percentage of cars within the desired price range.
Estimation that at least 91.3% of cars should sell within the specified price range based on the theorem.
Conclusion summarizing the utility of Chebyshev's theorem in providing a ballpark estimate for data distribution.
Invitation to visit the website for more educational content on mathematical concepts.
Transcripts
Browse More Related Video
Chebyshev's Theorem

What Is And How To Use Chebyshev's Theorem And The Empirical Rule Formula In Statistics Explained

Empirical Rule of Standard Deviation in Statistics
Statistics - How to use the Empirical Rule
How to Use the Empirical Rule with Examples
Empirical Rule (68-95-99.7) for Normal Distributions
5.0 / 5 (0 votes)
Thanks for rating: