Empirical Rule (68-95-99.7) for Normal Distributions
TLDRThis video script introduces the empirical rule, which applies to normal distributions. It explains that approximately 68% of data falls within one standard deviation of the mean, 95% within two, and 99.7% within three. The script uses a bell-shaped distribution example with a mean of 60 and a standard deviation of 5 to illustrate how to calculate percentages within different ranges of the mean. It concludes with a series of examples demonstrating the application of the empirical rule to find specific data percentages, providing a clear and concise explanation of the concept.
Takeaways
- 📊 The empirical rule is applicable to normal or bell-shaped distributions, providing a statistical measure of data distribution around the mean.
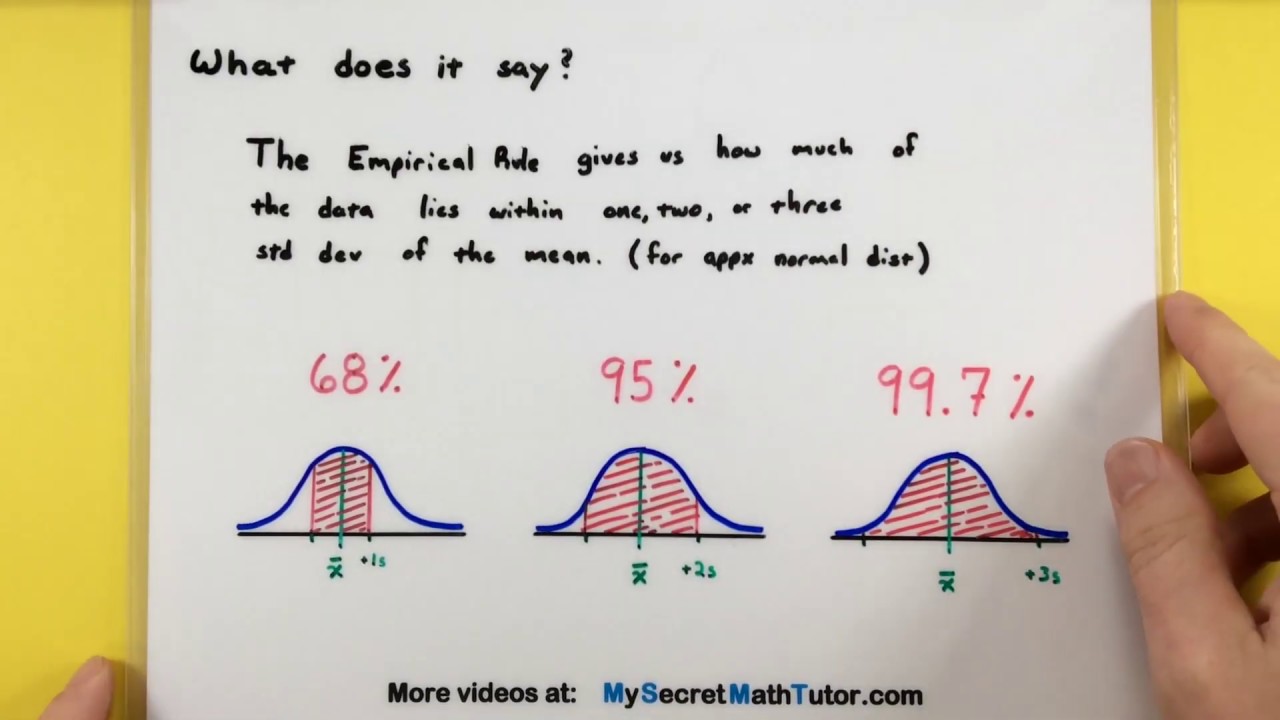
- 🔢 Approximately 68% of data values lie within one standard deviation of the mean in a normal distribution.
- 📈 Expanding the range to two standard deviations encompasses about 95% of the data values.
- 📉 The remaining 5% of data values fall outside two standard deviations, with 2.5% in each tail of the distribution.
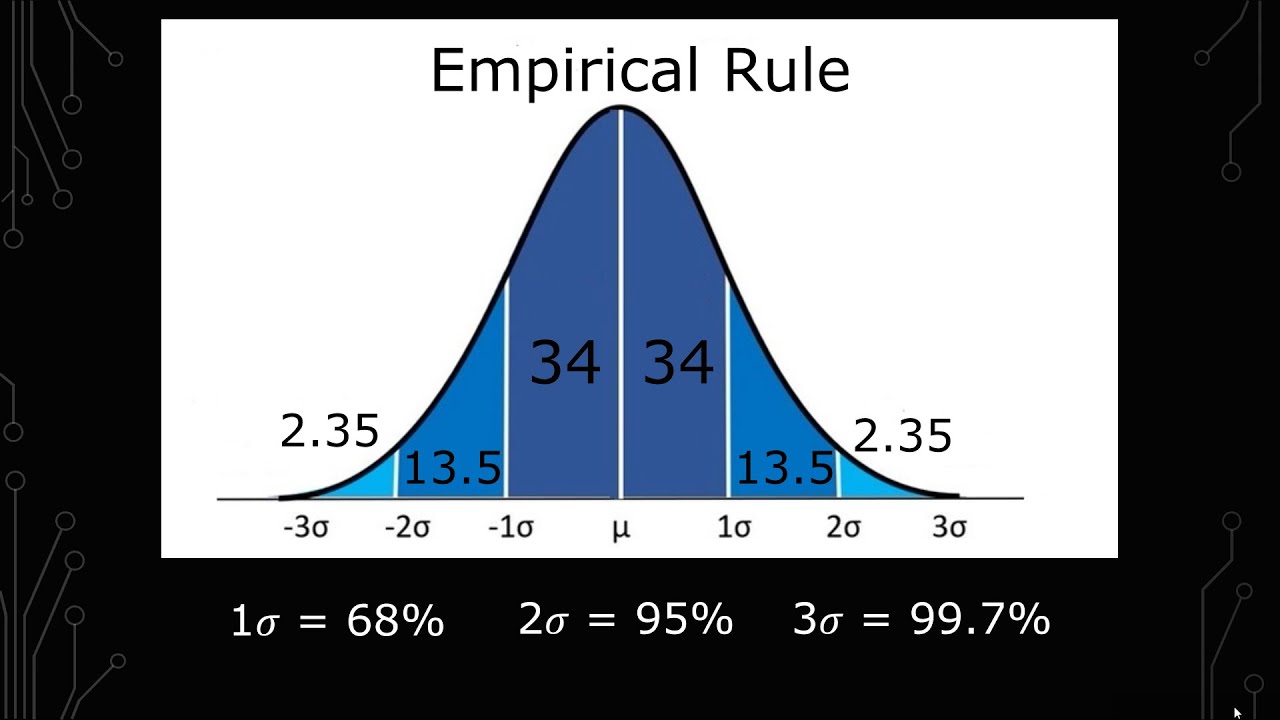
- 📍 The area between the mean and one standard deviation is divided equally, with 34% on each side of the mean.
- 📊 Within two standard deviations, 47.5% of the data is on each side, leaving 2.5% in the tails.
- 📈 The area between the mean and one standard deviation above or below is 13.5%, calculated as 47.5% minus 34%.
- 📉 At three standard deviations, 49.85% of the data is on each side, with 0.15% in the tails.
- 📍 The area between 65 and 70 in a distribution with a mean of 60 and a standard deviation of 5 is 2.35%.
- 🔑 The empirical rule helps in quickly estimating the proportion of data within certain ranges relative to the mean and standard deviation.
- 📝 The script provides a step-by-step explanation of how to apply the empirical rule to a specific bell-shaped distribution with given mean and standard deviation values.
Q & A
What is the empirical rule?
-The empirical rule is a statistical concept that applies to normal or bell-shaped distributions, stating that approximately 68% of data values fall within one standard deviation of the mean, about 95% within two standard deviations, and about 99.7% within three standard deviations of the mean.
How is the empirical rule related to a normal distribution with a mean of 0?
-For a normal distribution with a mean of 0, the empirical rule helps us understand the distribution of data around the mean, with 68% of the data values falling between -1 and 1 standard deviation, 95% between -2 and 2 standard deviations, and 99.7% between -3 and 3 standard deviations.
What percentage of data falls within one standard deviation of the mean in a normal distribution?
-In a normal distribution, approximately 68% of the data falls within one standard deviation of the mean.
How much area is represented by each tail in a normal distribution when considering one standard deviation?
-Each tail of a normal distribution represents about 16% of the area when considering one standard deviation from the mean.
What is the area between the mean and one standard deviation in a normal distribution?
-The area between the mean and one standard deviation in a normal distribution is 34%, which is half of the 68% that falls within one standard deviation of the mean.
What is the percentage of data that falls within two standard deviations of the mean in a normal distribution?
-Approximately 95% of data falls within two standard deviations of the mean in a normal distribution.
How much area is left in the tails when considering two standard deviations from the mean in a normal distribution?
-When considering two standard deviations from the mean in a normal distribution, there is approximately 2.5% of the area left in each tail, totaling 5%.
What is the area between the mean and two standard deviations in a normal distribution?
-The area between the mean and two standard deviations in a normal distribution is 47.5%, which is half of the 95% that falls within two standard deviations of the mean.
What is the percentage of data that falls within three standard deviations of the mean in a normal distribution?
-Approximately 99.7% of data falls within three standard deviations of the mean in a normal distribution.
How much area is left in the tails when considering three standard deviations from the mean in a normal distribution?
-When considering three standard deviations from the mean in a normal distribution, there is approximately 0.15% of the area left in each tail, totaling 0.3%.
What is the area between the mean and three standard deviations in a normal distribution?
-The area between the mean and three standard deviations in a normal distribution is 49.85%, which is half of the 99.7% that falls within three standard deviations of the mean.
If a bell-shaped distribution has a mean of 60 and a standard deviation of 5, what is one standard deviation above the mean?
-In a bell-shaped distribution with a mean of 60 and a standard deviation of 5, one standard deviation above the mean is 65.
What is the percentage of scores between 50 and 70 in a bell-shaped distribution with a mean of 60 and a standard deviation of 5?
-In a bell-shaped distribution with a mean of 60 and a standard deviation of 5, approximately 95% of the scores fall between 50 and 70, which are two standard deviations away from the mean.
What is the percentage of the area between 60 and 65 in a bell-shaped distribution with a mean of 60 and a standard deviation of 5?
-In a bell-shaped distribution with a mean of 60 and a standard deviation of 5, the area between 60 and 65 represents approximately 34% of the total area.
What is the percentage of scores greater than 65 in a bell-shaped distribution with a mean of 60 and a standard deviation of 5?
-In a bell-shaped distribution with a mean of 60 and a standard deviation of 5, the percentage of scores greater than 65 is 16%, which is 50% minus the 34% between the mean and one standard deviation.
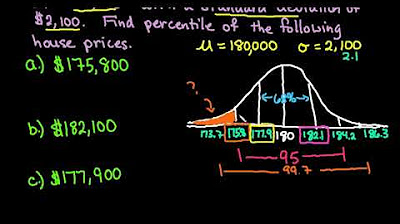
What is the percentage of scores between 70 and 75 in a bell-shaped distribution with a mean of 60 and a standard deviation of 5?
-In a bell-shaped distribution with a mean of 60 and a standard deviation of 5, the percentage of scores between 70 and 75 is approximately 2.35%.
How can you find the percentage between 55 and 75 in a bell-shaped distribution with a mean of 60 and a standard deviation of 5?
-In a bell-shaped distribution with a mean of 60 and a standard deviation of 5, the percentage between 55 and 75 can be found by adding the percentages within one standard deviation (68%), between one and two standard deviations (13.5%), and between two and three standard deviations (2.35%), which gives a total of 83.85%.
What is the percentage below 70 in a bell-shaped distribution with a mean of 60 and a standard deviation of 5?
-In a bell-shaped distribution with a mean of 60 and a standard deviation of 5, the percentage below 70 is 97.5%, which is found by adding the percentages within two standard deviations (47.5%) and within three standard deviations (50%).
Outlines
📊 Introduction to the Empirical Rule
This paragraph introduces the empirical rule, which is a statistical concept applicable to normal or bell-shaped distributions. It explains that if the mean is set at 0, approximately 68% of data values fall within one standard deviation of the mean, about 95% within two standard deviations, and 99.7% within three standard deviations. The script also breaks down the distribution percentages on either side of the mean, detailing the proportions in the tails and the central regions for each standard deviation considered.
Mindmap
Keywords
💡Empirical Rule
💡Normal Distribution
💡Mean
💡Standard Deviation
💡Bell-Shaped Distribution
💡Percentage
💡Symmetry
💡Data Values
💡Area Under the Curve
💡Tails
💡Contextual Application
Highlights
The empirical rule applies to normal or bell-shaped distributions.
Approximately 68% of data values fall within 1 standard deviation of the mean.
About 95% of data fall within 2 standard deviations of the mean.
Approximately 99.7% of data fall within 3 standard deviations of the mean.
The area on either side of the mean is 34% for 1 standard deviation.
16% of data are in each tail for 1 standard deviation.
47.5% of data are within 2 standard deviations on each side of the mean.
2.5% of data are in each tail for 2 standard deviations.
13.5% of data are between 1 and 2 standard deviations from the mean.
49.85% of data are within 3 standard deviations on each side of the mean.
0.15% of data are in the tails for 3 standard deviations.
2.35% of data are between 2 and 3 standard deviations from the mean.
50% of data are below 60 in a symmetric bell-shaped distribution.
95% of scores are between 50 and 70 when the mean is 60 and standard deviation is 5.
34% of data are between 60 and 65 in the distribution.
16% of data are greater than 65 in the distribution.
2.35% of data are between 70 and 75 in the distribution.
83.85% of data are between 55 and 75 by adding probabilities of different intervals.
97.5% of data are below 70 by adding probabilities and subtracting from 100%.
Transcripts
Browse More Related Video


5.0 / 5 (0 votes)
Thanks for rating: