How to Use the Empirical Rule with Examples
TLDRThis video script from 'Learn to Stats' introduces the Empirical Rule, also known as the 68-95-99.7 rule, which is a tool for understanding the distribution of data in a normal distribution. It explains how percentages of data fall within one, two, and three standard deviations from the mean. The script provides examples, such as test grades and birth weights, to illustrate how to apply the rule to find ranges and percentages within the distribution. The presenter encourages viewers to engage with the content by asking questions and sharing the video.
Takeaways
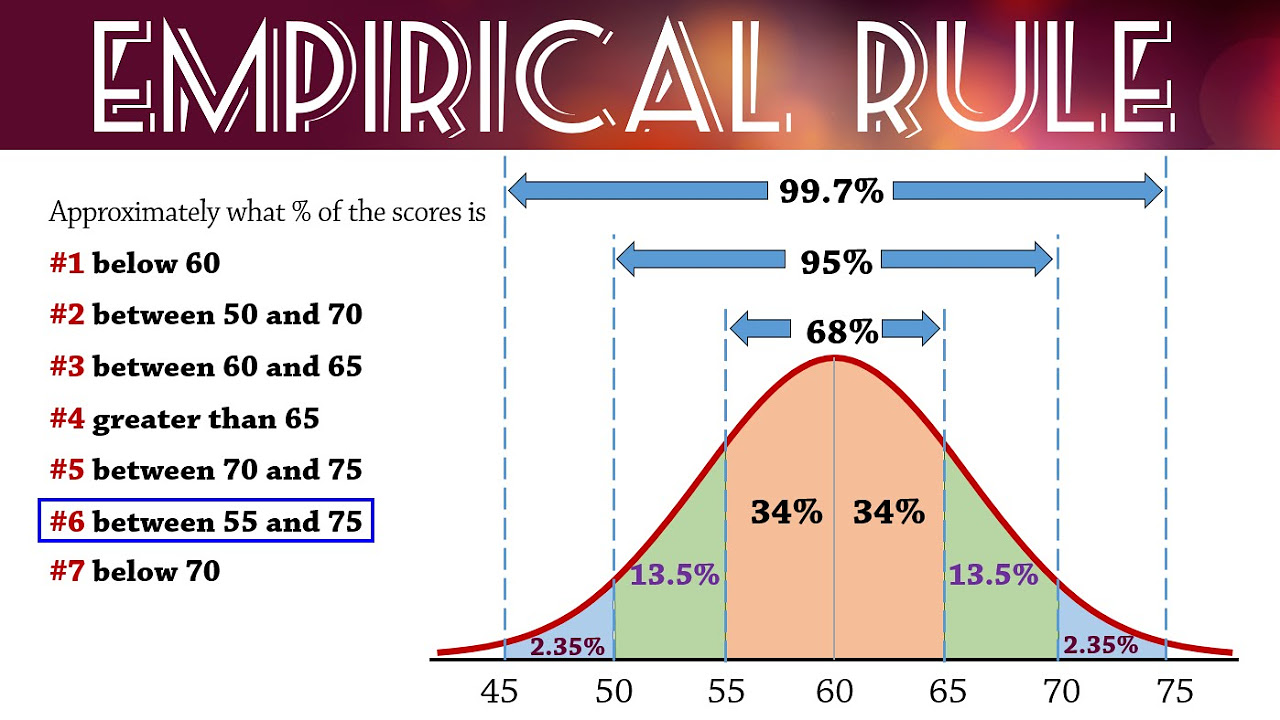
- 📚 The empirical rule, also known as the 68-95-99.7 rule, is a statistical tool for understanding the distribution of data in a normal distribution.
- 🔍 Within one standard deviation from the mean, approximately 34% of the data lies on either side, totaling 68%.
- 📉 Two standard deviations from the mean cover an additional 13.5% on each side, bringing the total to 95% of the data.
- 📈 Three standard deviations from the mean account for the remaining 2.35%, reaching a total of 99.7% of the data.
- 📝 The first example in the script illustrates how to calculate the range of test grades that includes 95% of the data, using a mean of 85 and a standard deviation of 4.
- 🧮 For the test grades example, the range from 77 to 93 includes approximately 95% of the grades, calculated by adding and subtracting two times the standard deviation from the mean.
- 👶 The second example discusses birth weights following a normal distribution with a mean of 3 kilograms and a standard deviation of 0.5 kilograms.
- 📊 The approximate percentage of birth weights between 2.5 and 3.5 kilograms is 68%, as this range is within one standard deviation from the mean.
- 🤔 A variation of the birth weight question asks for the percentage between 3 and 3.5 kilograms, which is half of the 68% range, equating to 34%.
- 📘 The script emphasizes the importance of understanding the normal distribution's symmetry when applying the empirical rule to calculate data ranges.
- 💬 The video encourages viewers to ask questions or leave comments for further discussion, and to like and share the content if found helpful.
Q & A
What is the Empirical Rule also known as?
-The Empirical Rule is also known as the 68-95-99.7 Rule.
What does the Empirical Rule approximate?
-The Empirical Rule approximates the distribution of data in a normal distribution, showing how much of the data falls within certain ranges of standard deviations from the mean.
What percentage of data is included within one standard deviation from the mean in a normal distribution according to the Empirical Rule?
-Approximately 34% of the data on each side of the mean, totaling 68%.
What is the percentage of data within two standard deviations from the mean in a normal distribution?
-Approximately 95% of the data is included within two standard deviations from the mean.
How much of the data falls within three standard deviations from the mean in a normal distribution?
-Approximately 99.7% of the data falls within three standard deviations from the mean.
In the first example, what is the mean and standard deviation of the test grades?
-The mean of the test grades is 85, and the standard deviation is 4.
What range of grades includes 95% of the grades in the first example?
-Approximately 95% of the grades are between 77 and 93.
What is the mean and standard deviation of birth weights in the second example?
-The mean birth weight is 3 kilograms, and the standard deviation is 0.5 kilograms.
What is the approximate percentage of birth weights between 2.5 kilograms and 3.5 kilograms?
-Approximately 68% of birth weights fall between 2.5 kilograms and 3.5 kilograms.
In the variation of the second example, what is the approximate percentage of birth weights between 3 kilograms and 3.5 kilograms?
-Approximately 34% of birth weights fall between 3 kilograms and 3.5 kilograms.
Why does the Empirical Rule work for the normal distribution?
-The Empirical Rule works for the normal distribution because of its symmetrical properties, allowing for easy mathematical calculations regarding data distribution around the mean.
Outlines
📚 Introduction to the Empirical Rule
The video script introduces the empirical rule, also known as the 68-95-99.7 rule, which is an approximation used with normal distributions to understand data distribution. It explains how much of the data falls within one, two, or three standard deviations from the mean, with percentages of 68%, 95%, and 99.7% respectively. The script then sets up an example involving test grades normally distributed with a mean of 85 and a standard deviation of 4, aiming to find the range that includes 95% of the grades.
📉 Application of the Empirical Rule to Test Grades
This section of the script applies the empirical rule to a specific example of test grades. It demonstrates how to calculate the range of grades that includes 95% of the data by using the mean and standard deviation provided. The calculation involves adding and subtracting two times the standard deviation from the mean, resulting in a range from 77 to 93. This example illustrates the practical use of the empirical rule in determining data ranges.
👶 Birth Weights and the Normal Distribution
The script moves on to another example involving birth weights, which are normally distributed with a mean of 3 kilograms and a standard deviation of 0.5 kilograms. It asks for the approximate percentage of birth weights between 2.5 and 3.5 kilograms. The explanation involves understanding that these weights are within one standard deviation from the mean, which corresponds to approximately 68% of the data, according to the empirical rule.
🔄 Variation in the Birth Weights Example
The final part of the script discusses a variation of the birth weights question, where the mean is included in the range. It explains how the empirical rule, being symmetrical, can be used to determine that the percentage of birth weights between 3 and 3.5 kilograms is half of the 68%, which is 34%. This part of the script emphasizes the importance of understanding the symmetrical nature of the normal distribution when applying the empirical rule.
Mindmap
Keywords
💡Empirical Rule
💡Normal Distribution
💡Mean
💡Standard Deviation
💡Symmetric
💡Percentage
💡Test Grades
💡Birth Weights
💡Bell-Shaped Curve
💡Contextual Application
Highlights
Introduction to the empirical rule, also known as the 68-95-99.7 rule.
Explanation of the empirical rule for normal distribution data.
34% of data falls within one standard deviation of the mean on both sides.
68% of data is within one standard deviation of the mean in total.
13.5% of data is within two standard deviations of the mean on each side.
95% of data is within two standard deviations of the mean in total.
2.35% of data is within three standard deviations of the mean on each side.
99.7% of data is within three standard deviations of the mean in total.
Example: Calculating the range of grades that includes 95% of the data.
Mean and standard deviation are key for applying the empirical rule.
Two standard deviations cover 95% of the data.
Example: Birth weights follow a normal distribution with a mean of 3 kg and SD of 0.5 kg.
Approximate percentage of birth weights between 2.5 kg and 3.5 kg.
Bell-shaped curve is another term for the normal distribution.
68% of birth weights are between 2.5 kg and 3.5 kg, within one standard deviation.
Variation: Calculating percentage of birth weights between 3 kg and 3.5 kg.
34% of birth weights are above the mean within one standard deviation.
Encouragement to ask questions or leave comments for further discussion.
Request for likes, shares, and watching to stay updated with the channel.
Transcripts
Browse More Related Video
Empirical Rule (68-95-99.7) for Normal Distributions

Empirical Rule of Standard Deviation in Statistics

Statistics - How to use the Empirical Rule

Normal Distribution & Probability Problems

k12.org exercise: Standard normal distribution and the empirical | Khan Academy
Empirical Rule 68-95-99.7 Rule to Find Percentile
5.0 / 5 (0 votes)
Thanks for rating: