Deriving a Confidence Interval for the Mean (The Rationale Behind the Confidence Interval Formula)
TLDRThis video script explains the process of deriving a confidence interval for the population mean (mu) from a normally distributed population with a known standard deviation (sigma). It introduces the concept of the sample mean (X bar) as a random variable and its distribution, leading to the standardization of X bar into a standard normal distribution. The script then utilizes the standard normal distribution properties to establish the formula for the confidence interval of mu, highlighting the role of the confidence level (1-alpha) and the margin of error. The explanation is geared towards providing clarity on how to calculate and interpret confidence intervals, with a focus on a 95% confidence level example.
Takeaways
- 📊 Confidence intervals estimate the population mean (mu) from a sample when the population standard deviation (sigma) is known.
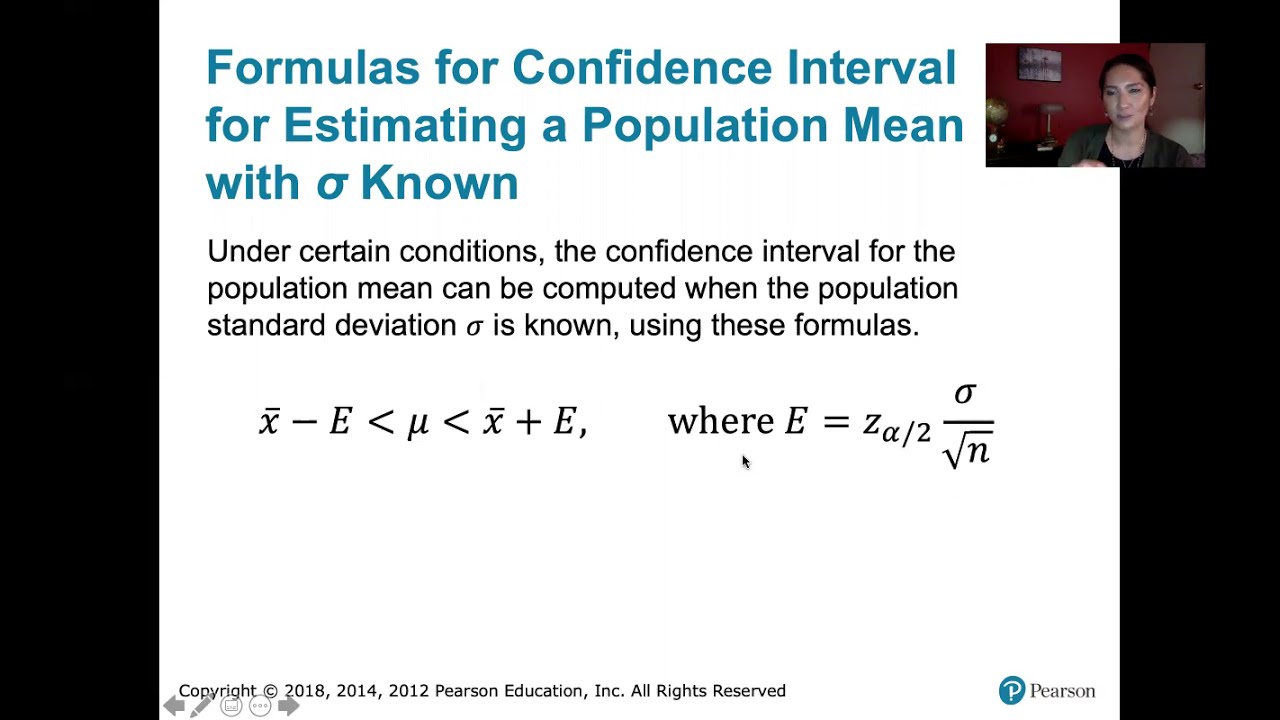
- 🎯 The general form of a confidence interval for mu is X bar ± margin of error, where X bar is the sample mean.
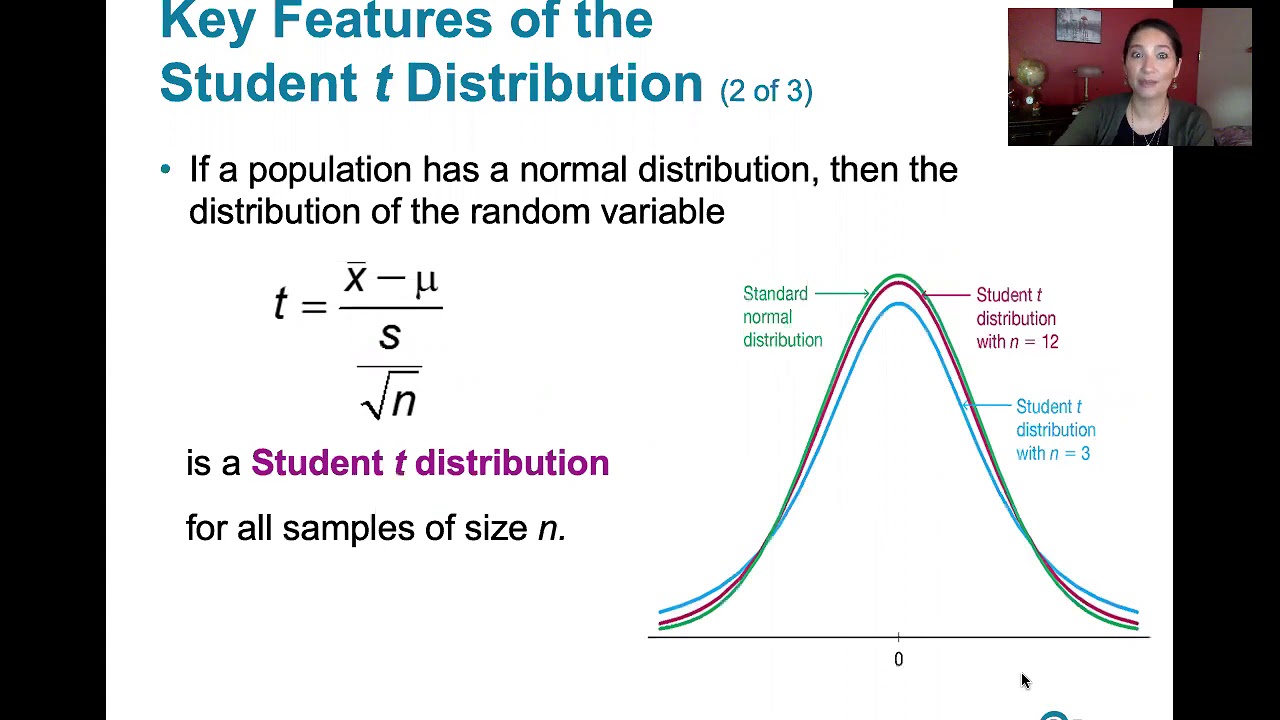
- 🌟 The sample mean (X bar) is a normally distributed random variable with a mean of mu and a standard deviation of sigma/√n.
- 🔄 Standardizing X bar involves the transformation (X bar - mu) / (sigma / √n), resulting in a standard normal distribution Z.
- 📈 The standard normal distribution has specific properties, such as the probability of Z falling between -1.96 and 1.96 being 0.95.
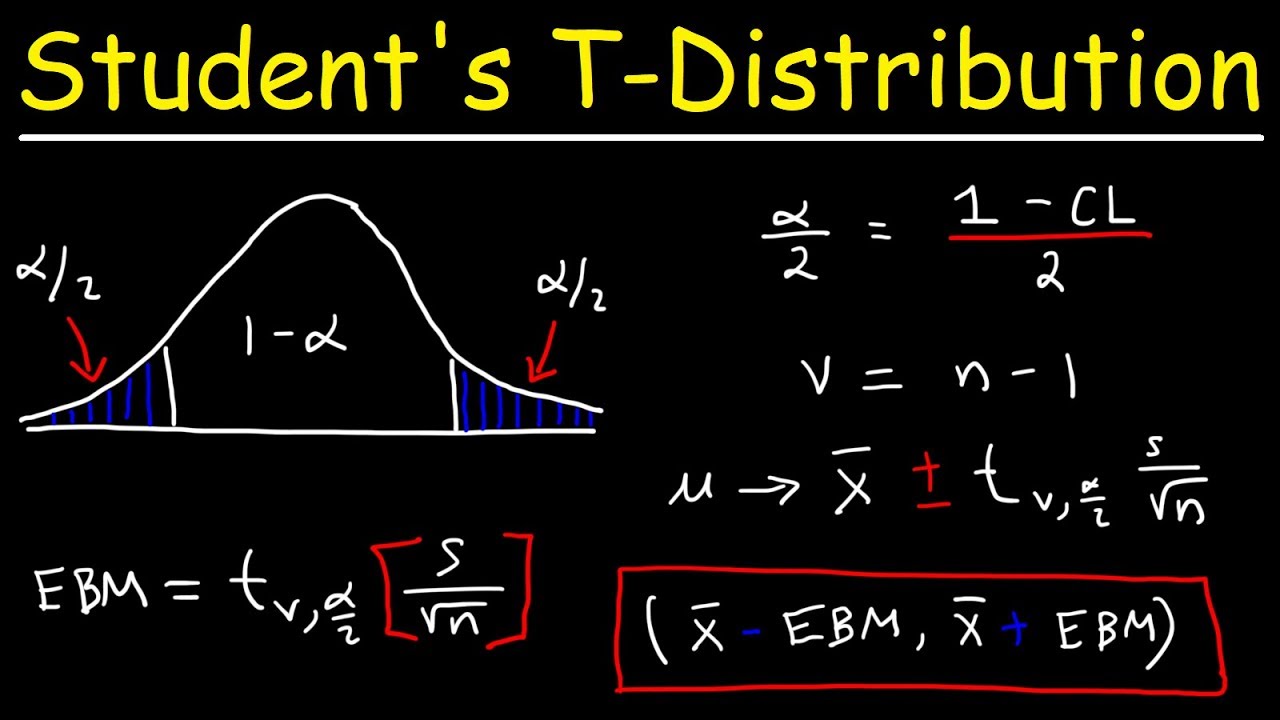
- 🔢 The probability that Z falls between -z_alpha/2 and z_alpha/2 is 1-alpha, which is the chosen confidence level.
- 🔍 To find the confidence interval for mu, algebra is used to isolate mu in the equation involving the standard normal distribution.
- 🏹 The (1-alpha)100% confidence interval for mu is given by X bar ± z_alpha/2 * (sigma / √n).
- 📝 The sample mean (X bar) becomes the lower bound for the confidence interval and the sample mean plus the margin of error becomes the upper bound.
- 🔢 For a 95% confidence interval, alpha is 0.05, and z_0.025 is 1.96, resulting in the formula X bar ± 1.96 * (sigma / √n).
- 📚 The video script provides a foundation for understanding and calculating confidence intervals, with examples and interpretations discussed in other videos.
Q & A
What is the main topic of the video?
-The main topic of the video is deriving a confidence interval for the population mean mu when sampling from a normally distributed population with a known standard deviation sigma.
What is the general form of the confidence interval for mu?
-The general form of the confidence interval for mu is X bar plus and minus the margin of error.
What is X bar in the context of the video?
-X bar is the sample mean in the context of the video.
What is the standard deviation of the sampling distribution of X bar?
-The standard deviation of the sampling distribution of X bar is sigma over the square root of n.
How can X bar be standardized?
-X bar can be standardized by subtracting its mean (mu) and dividing by its standard deviation (sigma over the square root of n), resulting in a random variable Z with a standard normal distribution.
What is the probability range for a standard normal random variable Z?
-The probability that a standard normal random variable Z takes on a value between -1.96 and 1.96 is 0.95.
What does z_alpha/2 represent?
-z_alpha/2 is the value of z that yields an area to the right of alpha/2 in the standard normal distribution.
How is the confidence interval for mu expressed in terms of X bar and z_alpha/2?
-The confidence interval for mu is expressed as X bar minus z_alpha/2 times sigma over the square root of n to X bar plus z_alpha/2 times sigma over the square root of n.
What is the relationship between the sample mean and the confidence interval?
-The sample mean X bar is the center of the confidence interval, and the interval's width is determined by the margin of error, which depends on the sample mean, the population standard deviation sigma, and the sample size n.
How does the confidence level relate to the confidence interval?
-The confidence level, expressed as 1-alpha, represents the probability that the random variable falls within the confidence interval, indicating the level of confidence we have in capturing the true population mean mu.
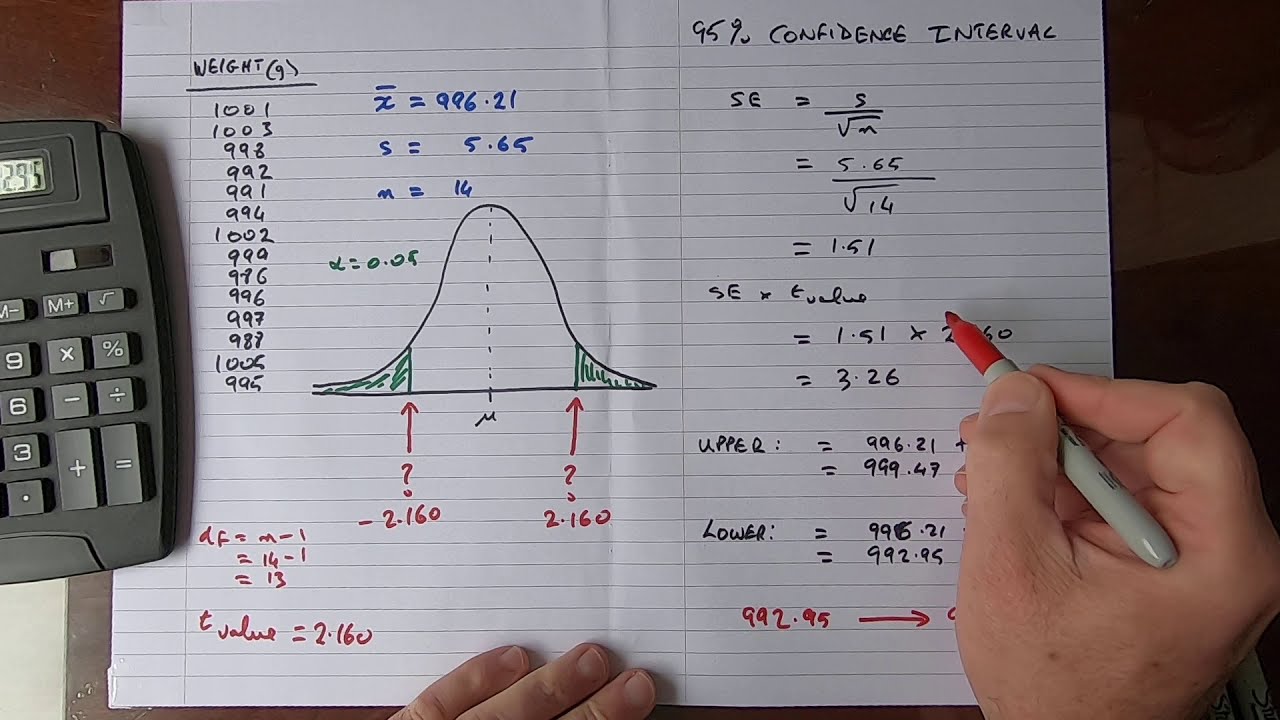
What is an example of a confidence interval calculation?
-For a 95% confidence interval, with alpha being 0.05, and using z_0.025 which is 1.96, the confidence interval for mu would be calculated as X bar plus and minus 1.96 times sigma over the square root of n.
Outlines
📊 Deriving the Confidence Interval for Population Mean
This paragraph introduces the concept of deriving a confidence interval for the population mean (mu) from a normally distributed population with a known standard deviation (sigma). It explains the process of determining the appropriate margin of error and the role of the sample mean (X bar) in this context. The paragraph discusses the normal distribution of X bar, its mean and standard deviation, and the concept of standardizing X bar to create a standard normal distribution (Z). It also covers the features of the standard normal distribution, particularly the probabilities associated with Z scores within a certain range, and how these probabilities are used to calculate the confidence interval for mu. The paragraph concludes with an algebraic derivation of the confidence interval formula and emphasizes the distinction between the random variable X bar and the fixed unknown quantity mu.
📈 Calculating and Interpreting the Confidence Interval
This paragraph delves into the practical application of the confidence interval formula derived in the previous section. It describes how to calculate the lower and upper bounds of the confidence interval and how these bounds relate to the confidence level (1-alpha). The paragraph provides an example of calculating a 95% confidence interval, explaining the significance of the z-score and its role in determining the margin of error. It also reiterates the importance of understanding that the sample mean (X bar) is a random variable, while the population mean (mu) is a fixed quantity that we aim to estimate. The paragraph concludes by summarizing the process and mentioning that examples of calculating and interpreting confidence intervals for mu will be covered in subsequent videos.
Mindmap
Keywords
💡confidence interval
💡population mean (mu)
💡sample mean (X bar)
💡margin of error
💡standard deviation (sigma)
💡sampling distribution
💡standard normal distribution
💡z-score
💡alpha (α)
💡critical z-value (z_alpha/2)
💡sample size (n)
💡confidence level (1-alpha)
Highlights
Deriving a confidence interval for the population mean mu when sampling from a normally distributed population.
The confidence interval formula for mu is X bar plus and minus the margin of error.
X bar represents the sample mean and sigma is the known population standard deviation.
The sample mean X bar is a random variable following a normal distribution with mean mu and standard deviation sigma/√n.
The notation sigma/√n is also represented as sigma X bar, indicating the standard deviation of the sampling distribution of X bar.
Standardizing X bar involves transforming it into a standard normal random variable Z by the formula (X bar - mu) / (sigma/√n).
The standard normal distribution has properties that are key to determining confidence intervals, such as the probability of Z falling between -1.96 and 1.96 being 0.95.
The confidence level can be chosen arbitrarily, with 95% being the most common.
The probability that Z falls between -z_alpha/2 and z_alpha/2 is 1-alpha, which is the basis for constructing confidence intervals.
The value z_alpha/2 corresponds to the area alpha/2 in the standard normal distribution.
The confidence interval for mu is given by X bar ± z_alpha/2 * (sigma/√n), capturing mu with a confidence level of 1-alpha.
The sample mean X bar is a random variable, while mu is a fixed unknown quantity we aim to estimate.
The calculated sample mean and its margin of error define the lower and upper bounds of the confidence interval.
The confidence interval provides an estimated range for mu with a specified confidence level, often expressed as a percentage.
For a 95% confidence interval, alpha is 0.05, and z_0.025 is 1.96, resulting in the formula X bar ± 1.96 * (sigma/√n).
The video discusses deriving the confidence interval formula and provides examples in subsequent videos.
Transcripts
Browse More Related Video
7.2.5 Estimating a Population Mean - Confidence Intervals with Known Pop. Standard Deviation
How To...Calculate the Confidence Interval for a Sample
7.2.1 Estimating a Population Mean - Student t Distribution and Finding Critical t Values

Confidence Interval Concept Explained | Statistics Tutorial #7 | MarinStatsLectures
Student's T Distribution - Confidence Intervals & Margin of Error

Confidence Interval for a population proportion | Solved Problems
5.0 / 5 (0 votes)
Thanks for rating: