How To...Calculate the Confidence Interval for a Sample
TLDRIn this informative video, Eugene Lachlan demonstrates the process of calculating the confidence interval for a sample size of 14 bags of food, each weighing one kilogram. He explains the importance of determining the sample mean, standard deviation, and degrees of freedom. Lachlan then illustrates how to use the t-distribution and t-tables to find the appropriate t-value for a 95% confidence level. He proceeds to calculate the standard error and margin of error, ultimately providing the confidence interval for the population mean. The video is a practical guide for those interested in understanding statistical calculations and quality control processes.
Takeaways
- 📊 The video is a tutorial on calculating the confidence interval for a sample.
- 🧮 Data from 14 bags of food, each weighing 1 kg, is used for the example.
- 📈 The sample mean (x̄) is calculated to be 996.21 grams.
- 📊 The standard deviation (s) of the sample is 5.65 grams.
- 🔢 The sample size (n) is 14, used for quality control in the production line.
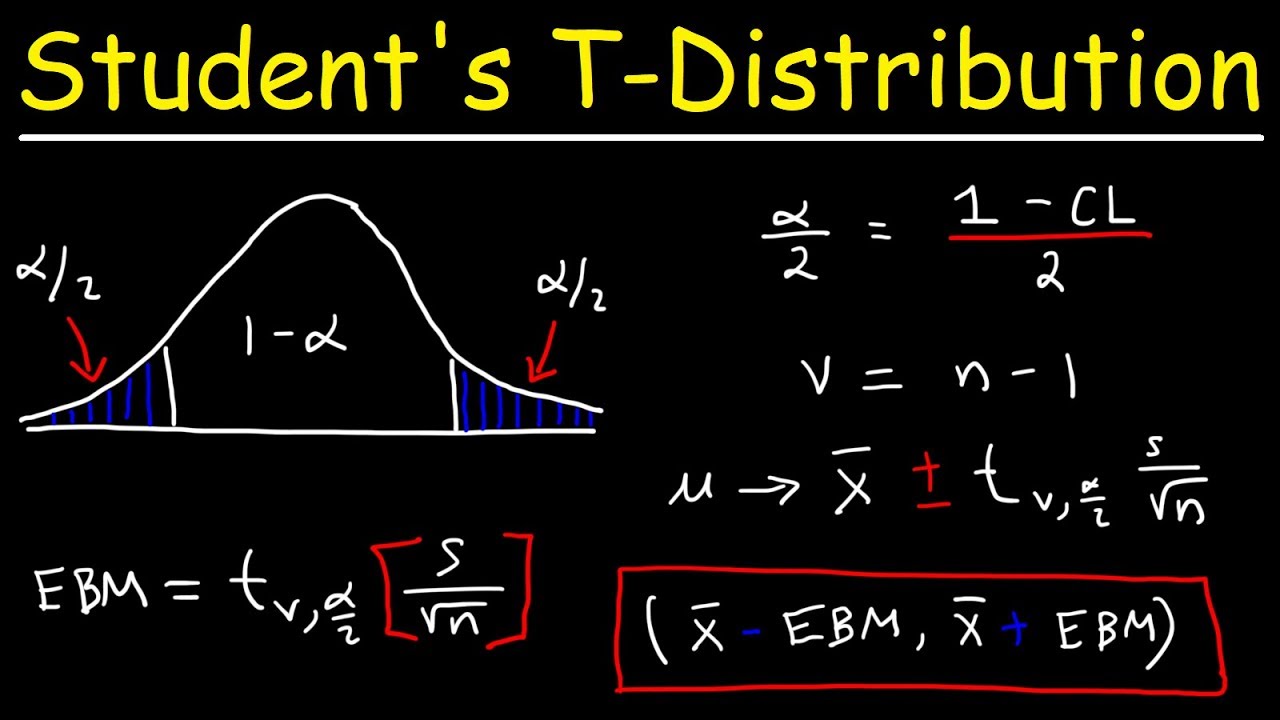
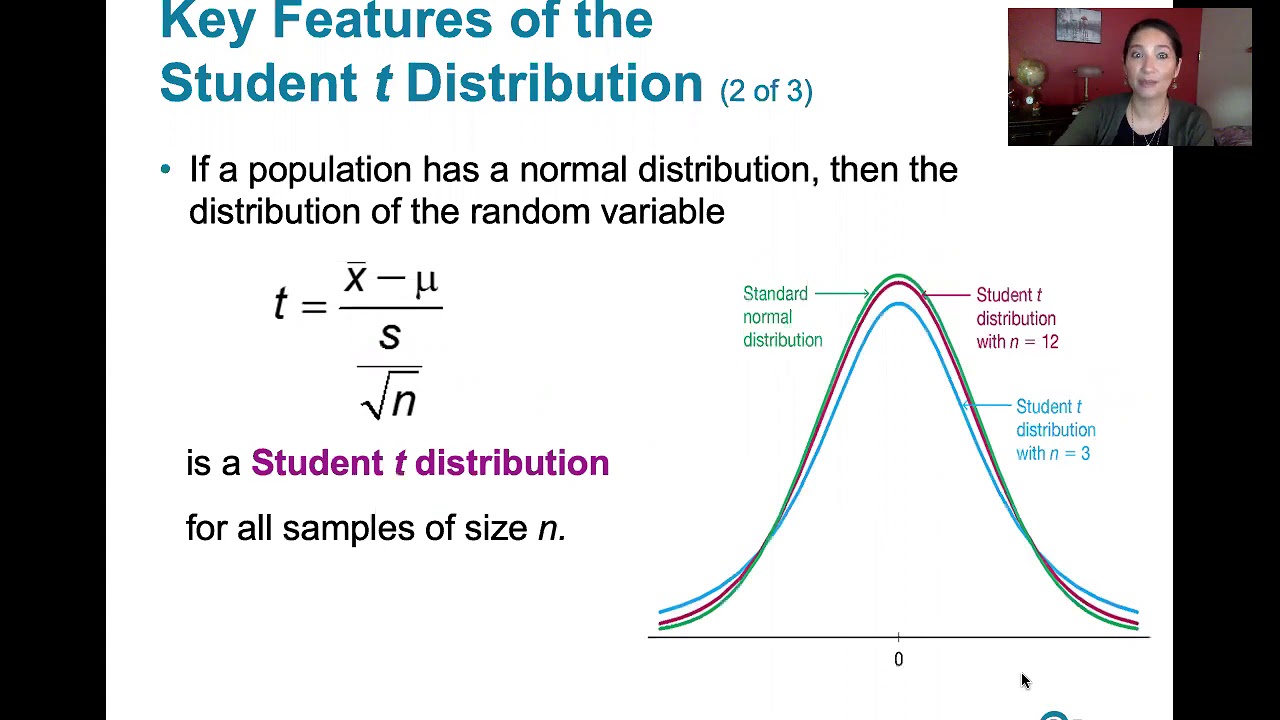
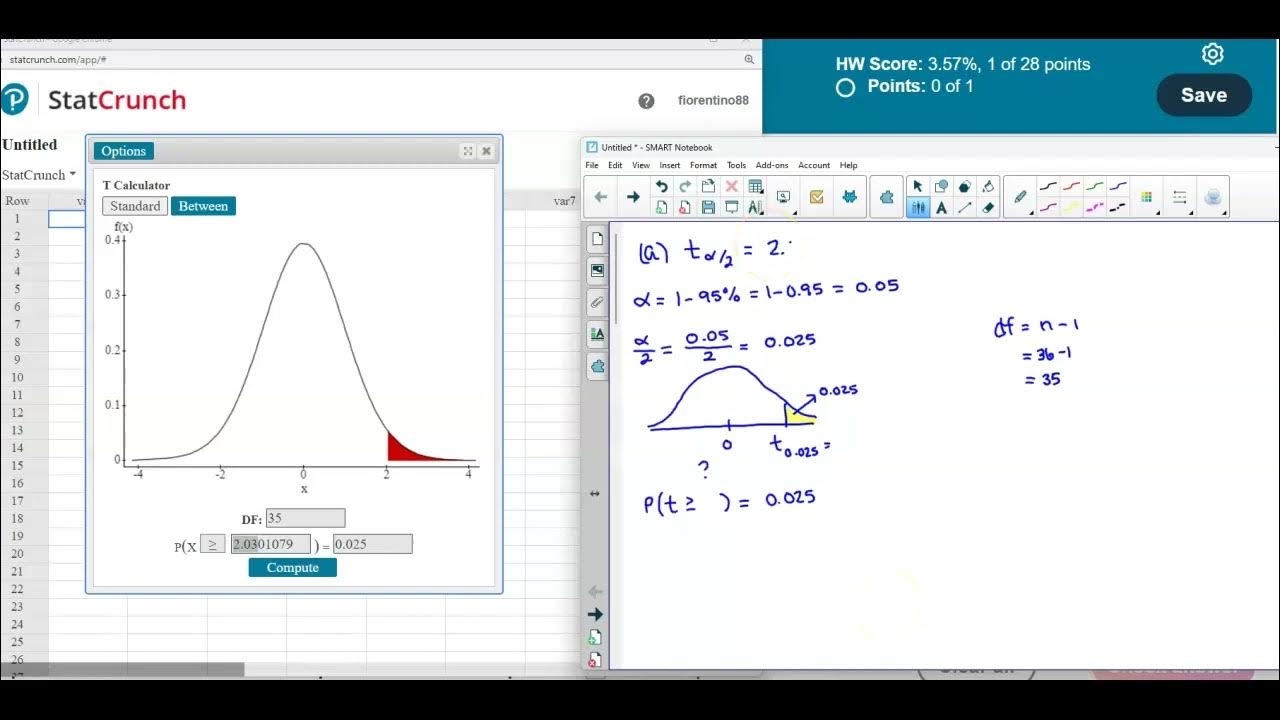
- 📝 T-distribution is introduced as a bell-shaped curve with the population mean at the center.
- 🧠 For a 95% confidence level, most values fall within the central area of the curve, and 5% in the tails.
- 🔍 The t-value for the given sample size and confidence level is found using t-tables.
- 👓 Degrees of freedom (df) are calculated as n minus 1, which is 13 in this case.
- 📊 The t-value for a 95% confidence level and 13 degrees of freedom is 2.160.
- 📝 The standard error (SE) of the mean is calculated using the sample standard deviation and the sample size.
- 📝 The confidence interval is calculated by multiplying the standard error by the t-value and adding/subtracting from the sample mean.
Q & A
What is the main topic of the video?
-The main topic of the video is to teach how to calculate the confidence interval for a sample manually.
What data is used in the example?
-The data used in the example are the weights of 14 randomly selected bags of food, each weighing one kilogram or 1,000 grams, from a production line for quality control purposes.
What are the sample mean, standard deviation, and sample size in the example?
-In the example, the sample mean (x̄) is 996.21 grams, the standard deviation (s) is 5.65, and the sample size (n) is 14.
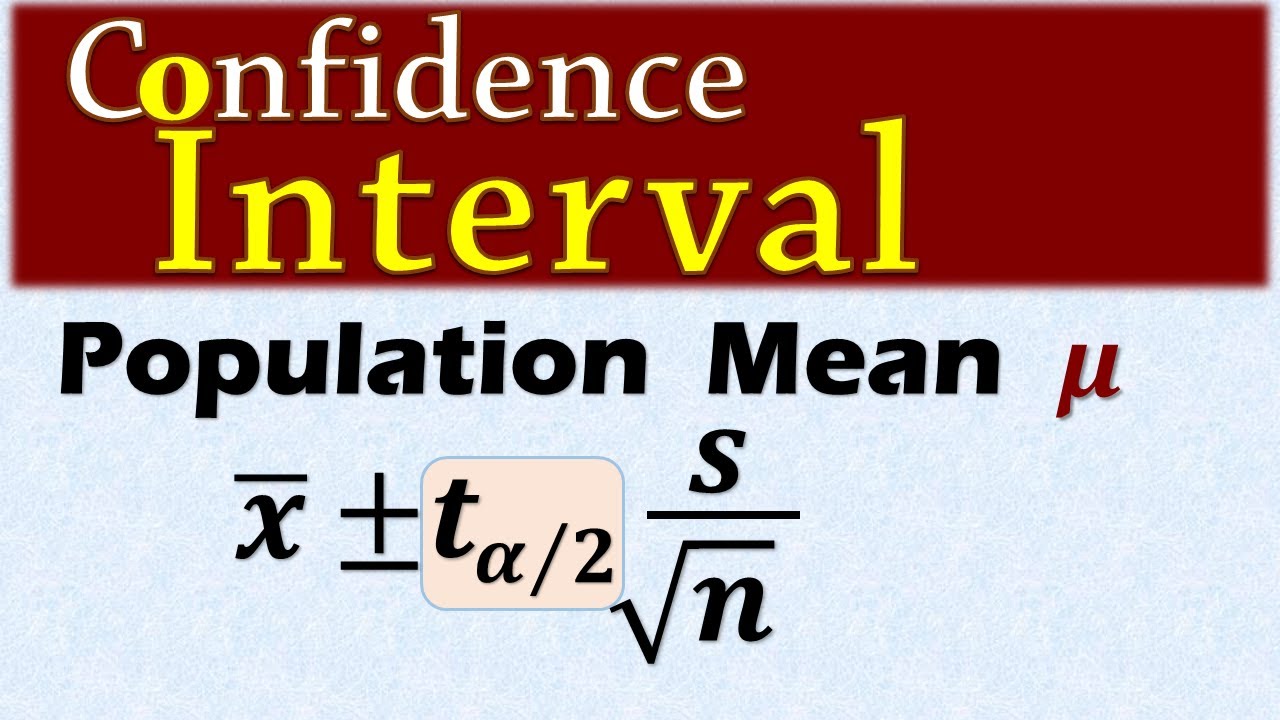
What is the significance of the t-distribution in calculating the confidence interval?
-The t-distribution is significant because it helps determine the t-value that corresponds to the desired confidence level and degrees of freedom, which is essential for calculating the margin of error in the confidence interval.
How is the degrees of freedom calculated in this context?
-In this context, the degrees of freedom (df) is calculated as the sample size (n) minus 1, which equals 13 for the given sample of 14.
What is the t-value for a 95% confidence level with 13 degrees of freedom?
-The t-value for a 95% confidence level with 13 degrees of freedom is 2.160, as found in the t-tables.
How is the standard error of the mean calculated?
-The standard error of the mean is calculated by dividing the sample standard deviation (s) by the square root of the sample size (n). In the example, it is calculated as 5.65 divided by the square root of 14, resulting in a standard error of 1.51.
What is the formula to calculate the margin of error for the confidence interval?
-The formula to calculate the margin of error for the confidence interval is the standard error multiplied by the t-value. In the example, it is 1.51 multiplied by 2.160, resulting in a margin of error of 3.8.
What are the lower and upper limits of the confidence interval in the example?
-In the example, the lower limit of the confidence interval is 992.89 grams, and the upper limit is 999.47 grams, with a 95% confidence level.
How would the confidence interval change if the confidence level were increased to 99%?
-If the confidence level were increased to 99%, the t-value would increase (to 3.012 for the given sample size), resulting in a wider margin of error and thus a broader confidence interval.
What can be concluded about the population mean with the calculated confidence interval?
-With the calculated confidence interval, it can be concluded with 95% confidence that the population mean lies between the lower and upper limits of the interval, which are 992.89 grams and 999.47 grams, respectively.
Outlines
📊 Introduction to Calculating Confidence Interval
This paragraph introduces the topic of the video, which is about calculating the confidence interval for a sample. The speaker, Eugene Lachlan, welcomes viewers to his series of how-to videos and explains that the video will demonstrate how to do this calculation by hand. He presents data from 14 bags of food, each weighing one kilogram, which were randomly selected for quality control. The speaker provides the sample mean (996.21 grams), standard deviation (5.65), and sample size (14). He then explains the concept of the t-distribution and how to use it to find the t-value for the given sample size and confidence level (95%). The degrees of freedom are calculated as n-1, resulting in 13 for this example. The speaker guides viewers on how to look up the t-value in t-tables and finds it to be 2.160 for a 95% confidence level.
🧮 Calculation of Standard Error and Confidence Interval
In this paragraph, the speaker continues the process of calculating the confidence interval by first determining the standard error of the mean. He explains the formula for standard error, which is the sample standard deviation divided by the square root of the sample size (n). Using the given standard deviation (5.65) and sample size (14), the standard error is calculated to be 1.51 grams. The speaker then describes how to use the standard error and the previously found t-value (2.160) to calculate the margin of error for the confidence interval. He performs the calculation, multiplying the standard error by the t-value, resulting in a margin of error of 3.8. Finally, the speaker explains how to find the upper and lower limits of the confidence interval by adding and subtracting the margin of error from the sample mean. The calculated confidence interval for the population mean is between 992.89 grams and 999.47 grams with a 95% confidence level. He also mentions that if a 99% confidence level were desired, the t-value and margin of error would be higher, resulting in a wider confidence interval.
Mindmap
Keywords
💡confidence interval
💡sample
💡mean
💡standard deviation
💡t distribution
💡degrees of freedom
💡t value
💡standard error
💡margin of error
💡quality control process
💡statistical calculations
Highlights
The video is a part of a series of short how-to videos aimed at teaching statistical concepts.
The specific topic of the video is calculating the confidence interval for a sample, which is demonstrated through manual calculations.
The data used in the example consists of 14 randomly selected bags of food weighing one kilogram each, from a production line for quality control purposes.
The sample mean (x̄) is calculated to be 996.21 grams, the standard deviation (s) is 5.65, and the sample size (n) is 14.
The concept of t-distribution is introduced, explaining its bell shape and how it's used to determine the confidence interval.
For a 95% confidence level, 95% of the values fall within the majority of the bell shape, with 2.5% in each tail of the distribution.
The degrees of freedom (df) are calculated as n minus 1, resulting in 13 for this sample size.
T-tables are used to find the t-value corresponding to the desired confidence level and degrees of freedom.
The t-value for a 95% confidence level with 13 degrees of freedom is found to be 2.160.
The standard error of the mean is calculated using the formula s / √n, resulting in a value of 1.51 for this example.
The margin of error for the confidence interval is determined by multiplying the standard error by the t-value.
The lower and upper limits of the confidence interval are calculated as the sample mean plus and minus the margin of error.
The confidence interval for the population mean is reported as 992.89 to 999.47 with a 95% confidence level.
The process can be adapted for different confidence levels by changing the t-value and adjusting the margin of error accordingly.
The video concludes by emphasizing the usefulness of the method for understanding and applying statistical calculations in practical scenarios.
Transcripts
Browse More Related Video
Student's T Distribution - Confidence Intervals & Margin of Error
Confidence Interval for a population mean - t distribution
7.2.1 Estimating a Population Mean - Student t Distribution and Finding Critical t Values
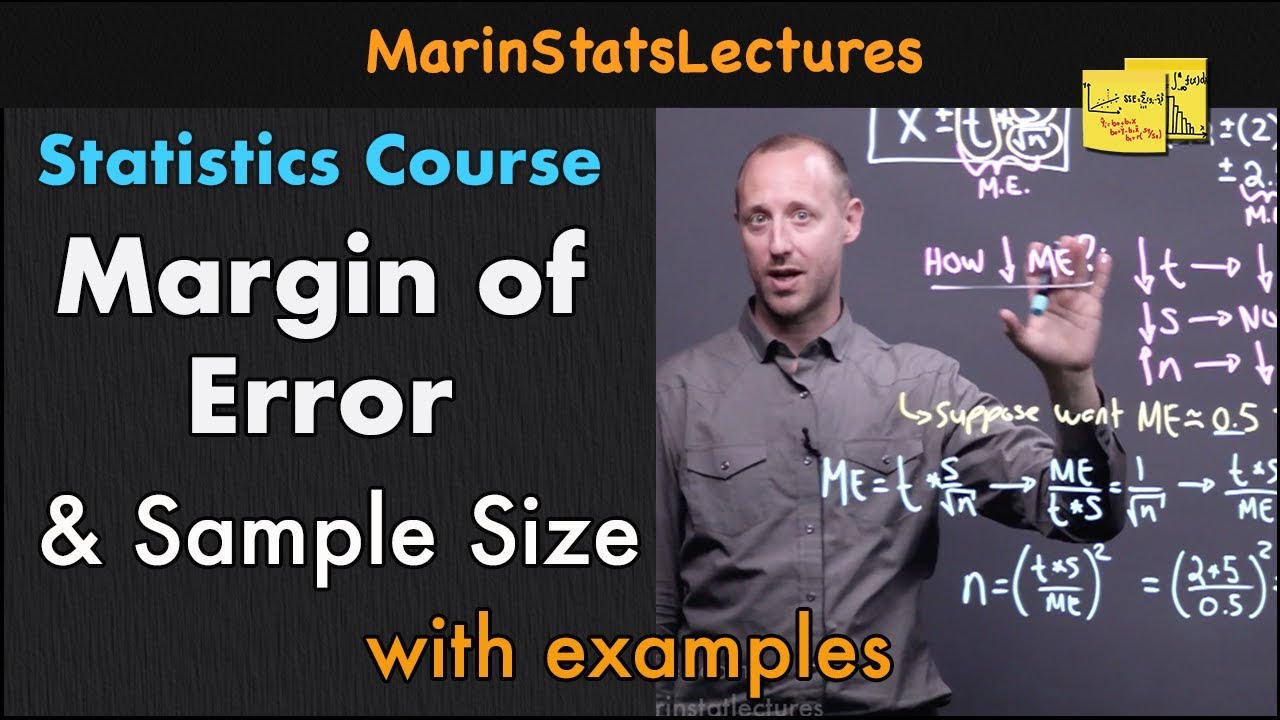
Margin of Error & Sample Size for Confidence Interval | Statistics Tutorial #11| MarinStatsLectures
Math 14 HW 7.2.5-T Find critical t value, margin of error & confidence interval for population mean.
Confidence Intervals | Population Mean: σ Unknown
5.0 / 5 (0 votes)
Thanks for rating: