Confidence Interval for a population mean - t distribution
TLDRThis video script explains the process of constructing confidence intervals for a population mean using the Student t-distribution. It emphasizes the importance of the sample size and the concept of degrees of freedom in determining the t-critical value. The video illustrates how the margin of error is calculated and how it affects the width of the confidence interval. Through examples, it demonstrates the estimation of population mean with different confidence levels and sample sizes, highlighting the central limit theorem's role in larger samples and the impact of sample size on the precision of the confidence interval.
Takeaways
- 📊 A confidence interval is a range of values estimated to include the population parameter at a given confidence level.
- 🧮 When the population standard deviation is unknown, the sample standard deviation and t-distribution are used instead of the Z distribution.
- 🔄 The t-distribution is similar to the normal distribution but has a larger standard deviation, making it flatter.
- 🔢 The shape of the t-distribution is determined by the degrees of freedom, which is calculated as the sample size minus one (n - 1).
- 📉 As degrees of freedom increase, the t-distribution more closely resembles the Z distribution.
- 🔍 The t-critical value is found using a table or software, based on the desired confidence level and degrees of freedom.
- 📈 The margin of error for estimating the population mean is calculated using the sample standard deviation, sample size, and t-critical value.
- 🔖 For small sample sizes, the assumption of normal population distribution is necessary, but this assumption becomes unnecessary for larger sample sizes due to the central limit theorem.
- 📉 Increasing the sample size decreases the margin of error, resulting in a narrower confidence interval, while a higher confidence level increases the critical value and margin of error, leading to a wider interval.
- 🌟 The confidence interval is an estimate and may or may not contain the true population mean, but it provides a range within which the population mean is expected to fall with a certain level of confidence.
Q & A
What is a confidence interval for a population mean?
-A confidence interval for a population mean is a range of values, derived from sample data, that is likely to include the population parameter at a specified confidence level.
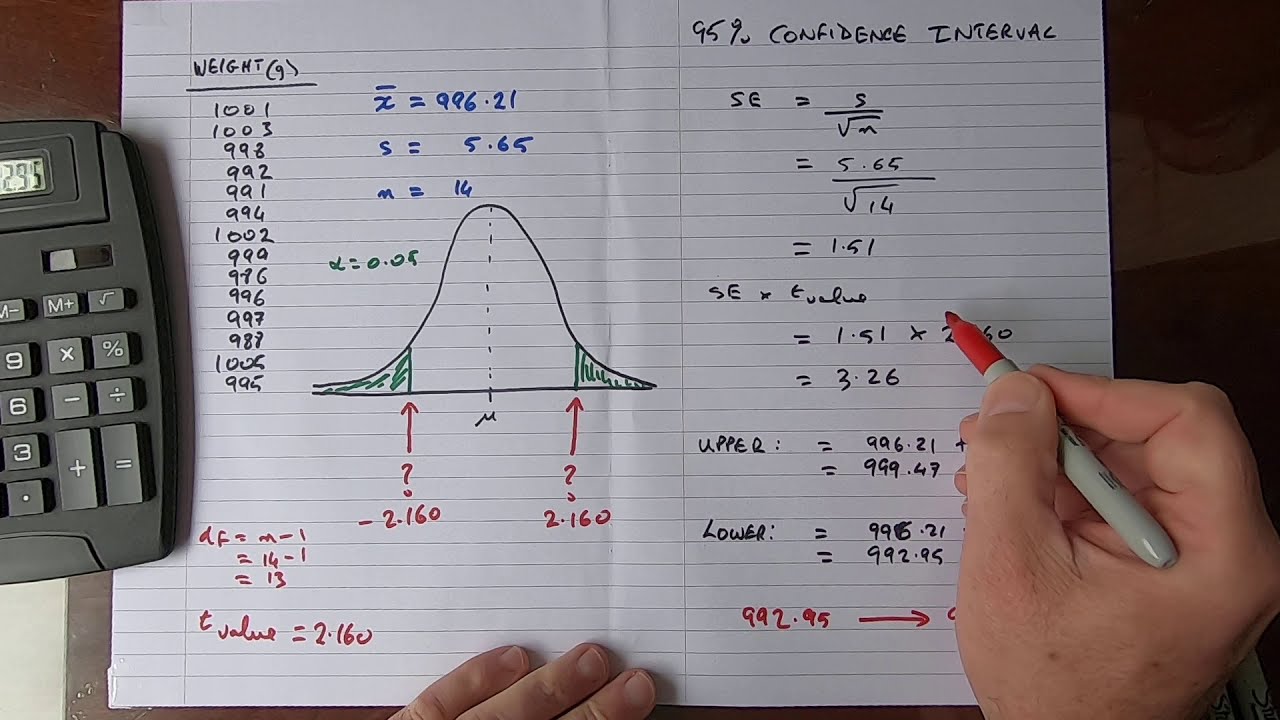
How is the margin of error calculated in constructing a confidence interval?
-The margin of error is calculated by taking the sample standard deviation, multiplying it by the t-critical value and dividing by the square root of the sample size (n).
Why is the t-distribution used instead of the Z distribution when constructing a confidence interval?
-The t-distribution is used when the population standard deviation is unknown and is replaced with the sample standard deviation. It is more appropriate for smaller sample sizes, whereas the Z distribution is used when the population standard deviation is known.
What are the key differences between the t-distribution and the standard normal (Z) distribution?
-Both t-distribution and Z distribution are bell-shaped with a mean of 0 and an area of 1 under the curve. However, the t-distribution has a greater standard deviation than the Z distribution, making it flatter. Additionally, there is a family of t-distributions, each with a shape determined by the degrees of freedom (df), whereas there is only one standard normal distribution.
How does the degrees of freedom (df) affect the shape of the t-distribution?
-The shape of the t-distribution is determined by the degrees of freedom, which is based on the sample size (n). As the degrees of freedom increase, the t-distribution becomes more similar to the standard normal (Z) distribution.
What is the significance of the sample size in determining whether to use the central limit theorem?
-Sample sizes of at least 30 are generally considered large enough for the central limit theorem to apply, allowing the use of the Z distribution without assuming a normal population distribution. Smaller sample sizes require the assumption of normality or the use of the t-distribution.
How does the confidence level affect the margin of error in a confidence interval?
-A higher confidence level results in a larger critical value, which in turn increases the margin of error, resulting in a wider confidence interval. Conversely, a lower confidence level will produce a smaller margin of error and a narrower confidence interval.
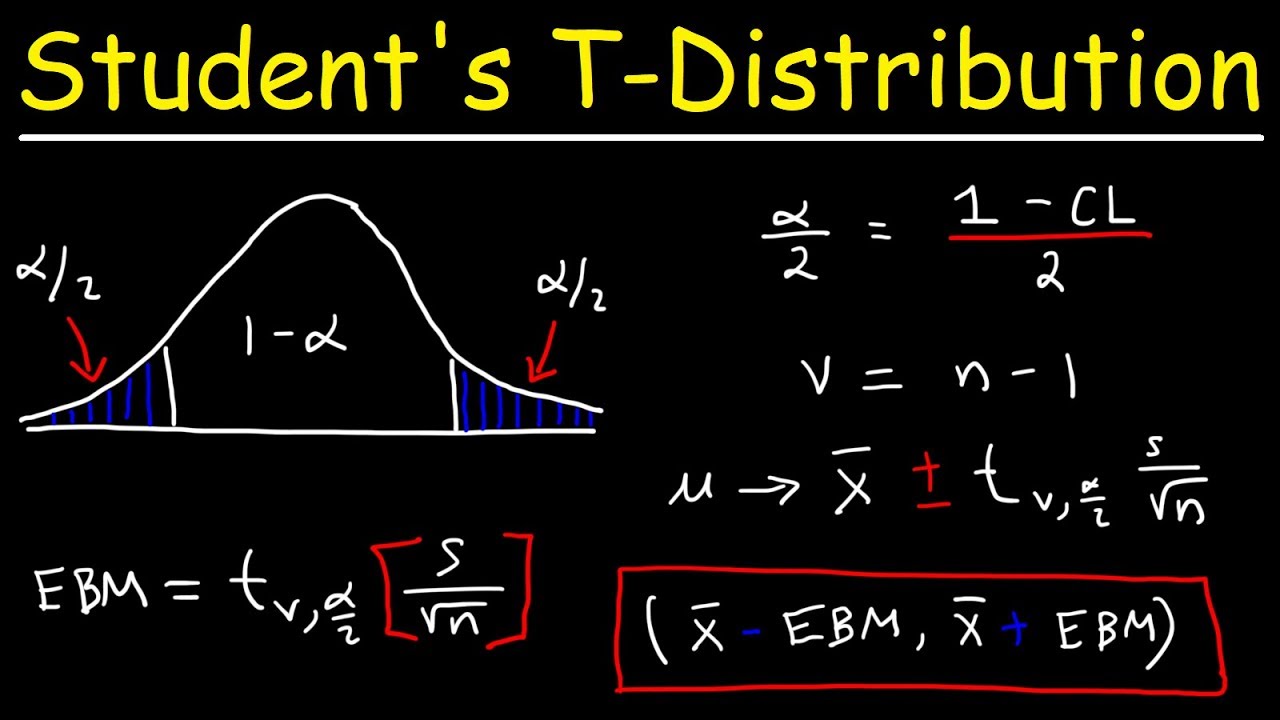
What is the formula for calculating the margin of error when constructing a confidence interval for a population mean?
-The margin of error is calculated using the formula: margin of error = t_α⁄2 * (s / √n), where t_α⁄2 is the critical t-value, s is the sample standard deviation, and n is the sample size.
How does the sample size affect the width of the confidence interval?
-Increasing the sample size will decrease the margin of error, resulting in a narrower confidence interval. Conversely, reducing the sample size will increase the margin of error, leading to a wider confidence interval.
What happens when the sample size is large enough to apply the central limit theorem?
-When the sample size is large (at least 30), the central limit theorem states that the distribution of sample means will be approximately normal, regardless of the population distribution. This eliminates the need to assume a normal population distribution for the calculations.
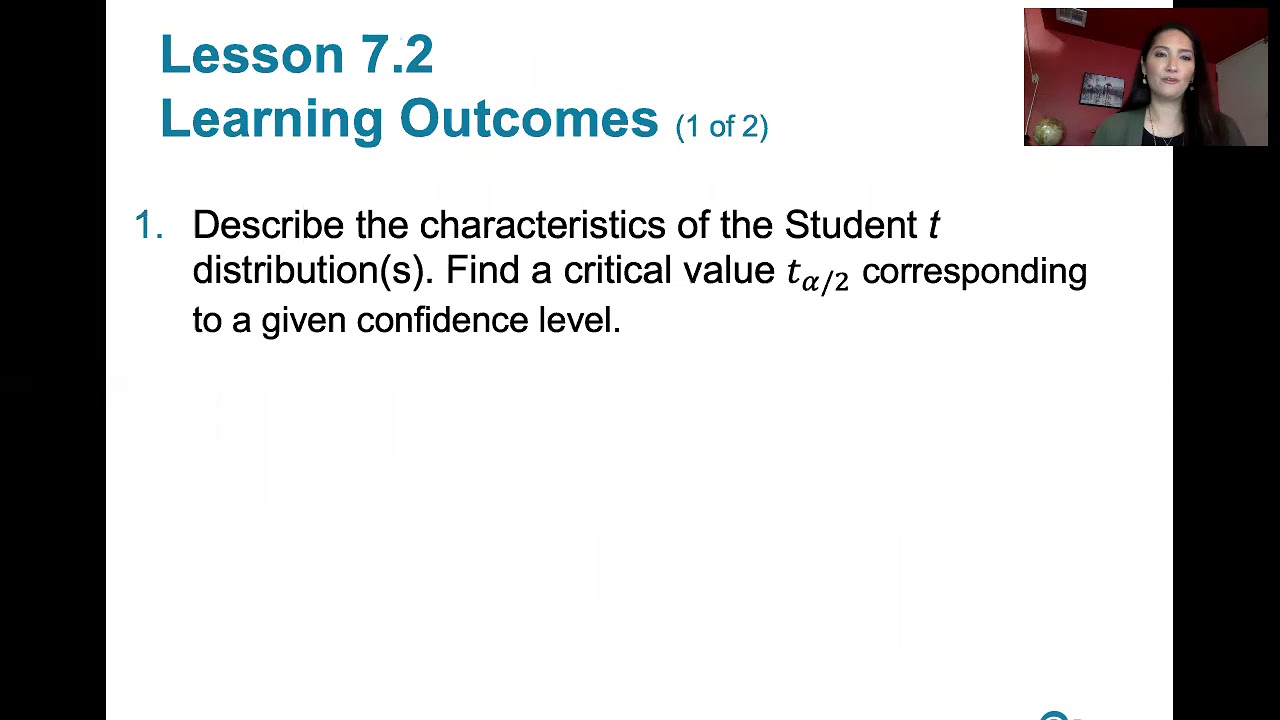
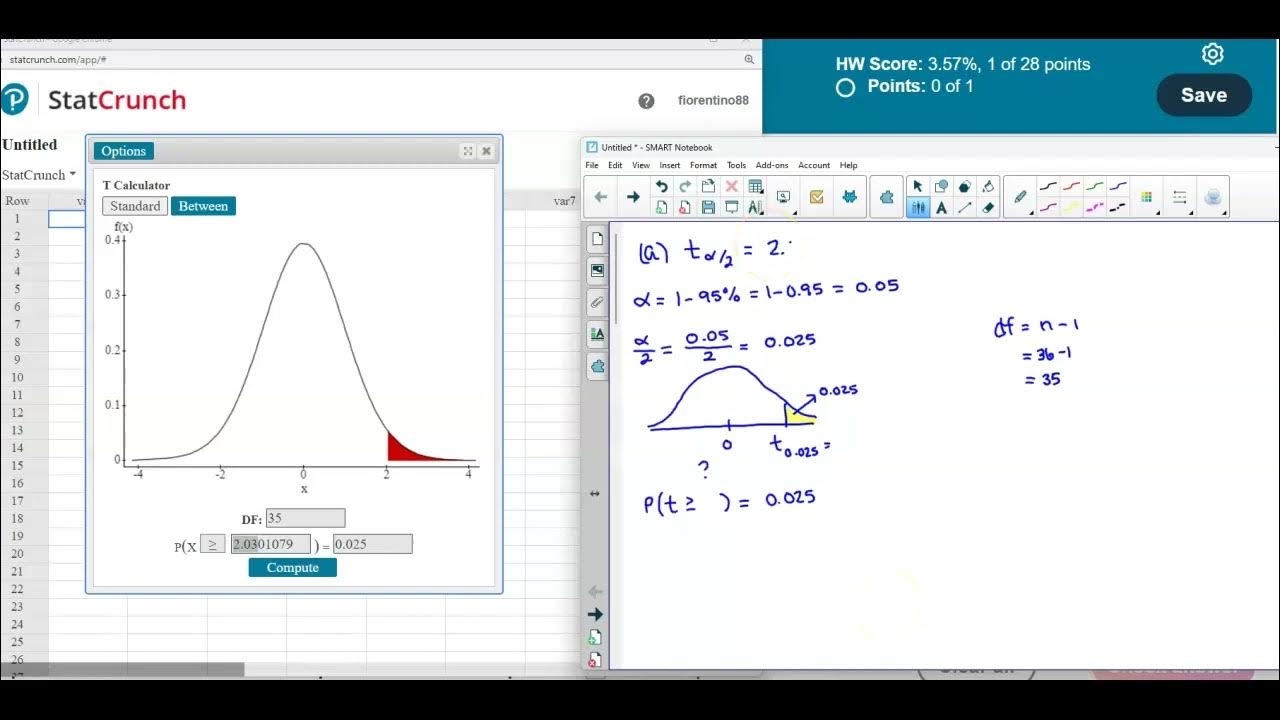
How can one find the critical t-value for a given confidence level and degrees of freedom?
-The critical t-value for a given confidence level and degrees of freedom can be found using a t-distribution table or statistical software. The t-value corresponds to the right tail area or two tails alpha, depending on the confidence level specified.
Outlines
📊 Introduction to Confidence Intervals and t-Distribution
This paragraph introduces the concept of constructing confidence intervals for a population mean using the Student t distribution. It explains that a confidence interval is a range of values that is likely to contain the population parameter at a specified confidence level. The paragraph outlines the process of determining the margin of error by using the sample mean and the t-distribution, which is necessary when the population standard deviation is unknown. It also discusses the t-distribution's similarity to the standard normal distribution and its dependence on degrees of freedom (df), which is based on the sample size n. The paragraph further explains how to use the t-distribution table to find the critical values for constructing the confidence interval.
🧮 Calculation and Interpretation of Confidence Intervals
This paragraph delves into the specifics of calculating the margin of error and confidence intervals for a population mean, given the sample standard deviation. It details the formula for the margin of error, which includes the critical t-value, sample standard deviation, and sample size. The paragraph emphasizes the significance level and how it relates to the confidence level. It provides an example with a sample size of 15 and a standard deviation of 3.5 to illustrate the process of estimating the population mean with a 95% confidence level. The paragraph also touches on the central limit theorem and its implications for small and large sample sizes. It concludes with an interpretation of the confidence interval, stating that there is a 95% confidence that the true population mean falls within the calculated range.
🔢 Impact of Sample Size and Confidence Level on Confidence Intervals
This paragraph discusses the impact of sample size and confidence level on the width of the confidence interval. It explains how increasing the sample size decreases the margin of error, resulting in a narrower confidence interval, while a higher confidence level leads to a larger critical value and a wider interval. The paragraph provides a second example with a sample size of 85 and a 99% confidence level to demonstrate these concepts. It also addresses the practicality of using t-tables and software for finding critical values when the degrees of freedom are not directly listed. The paragraph concludes by reiterating the concept that the constructed confidence interval represents the range within which the population mean is expected to fall with a certain level of confidence.
Mindmap
Keywords
💡confidence interval
💡population mean
💡Student t distribution
💡sample mean
💡margin of error
💡degrees of freedom
💡t-critical value
💡sample size
💡central limit theorem
💡standard deviation
💡confidence level
Highlights
The video discusses constructing confidence intervals for a population mean using the Student t distribution.
A confidence interval is a range of values likely to include the population parameter at a specified confidence level.
The margin of error is calculated by adding and subtracting it from the sample mean.
When the population standard deviation is unknown, the sample standard deviation and t-distribution are used.
The t-distribution is similar to the standard normal distribution but has a greater standard deviation, making it flatter.
The shape of the t-distribution is determined by degrees of freedom, which is based on the sample size n.
As degrees of freedom increase, the t distribution approaches the Z distribution.
The t-distribution table provides critical values for constructing confidence intervals.
The formula for the margin of error includes the t critical value, sample standard deviation, and sample size.
The significance level is 1 minus the confidence level, and it determines the critical values for the confidence interval.
For a small sample size of 12, the degrees of freedom is 11, and the critical value for a 90% confidence level is 1.796.
A sample size of 15 with a mean of 20 and standard deviation of 3.5 is used to estimate the population mean with a 95% confidence level.
For a sample size of 85, a 99% confidence interval is constructed, and the central limit theorem applies, assuming normal distribution.
Increasing the sample size decreases the margin of error, resulting in a narrower confidence interval.
A higher confidence level results in a larger critical value, a larger margin of error, and a wider confidence interval.
The video concludes by emphasizing the concept of confidence intervals and their use in estimating population parameters.
Transcripts
Browse More Related Video
Student's T Distribution - Confidence Intervals & Margin of Error
How To...Calculate the Confidence Interval for a Sample

Elementary Statistics - Chapter 7 - Estimating Parameters and Determining Sample Sizes Part 2
7.2.0 Estimating a Population Mean - Lesson Overview, Key Concepts, Learning Outcomes

Confidence Interval for a population proportion | Solved Problems
Math 14 HW 7.2.5-T Find critical t value, margin of error & confidence interval for population mean.
5.0 / 5 (0 votes)
Thanks for rating: