7.2.2 Estimating a Population Mean - Sample Mean, Margin of Error, and Finding Confidence Intervals
TLDRThis educational video script covers the concept of estimating the population mean using a point estimate and a confidence interval. It explains why the sample mean is the optimal point estimate and how to calculate the margin of error for a confidence interval, especially when the population standard deviation is unknown. The script also illustrates the process of constructing a confidence interval, including checking requirements, computing necessary values, and interpreting the results, using an example with DNA base codes to demonstrate the calculations.
Takeaways
- 📚 The video discusses learning outcome number two for lesson 7.2, focusing on estimating the population mean using a point estimate and a confidence interval.
- 🧐 The sample mean (x̄) is considered the best point estimate of the population mean because it is an unbiased estimator, meaning its expected value equals the population mean.
- 📉 A confidence interval provides a range that the true population mean (μ) is likely to fall within with a certain level of confidence, given repeated sampling.
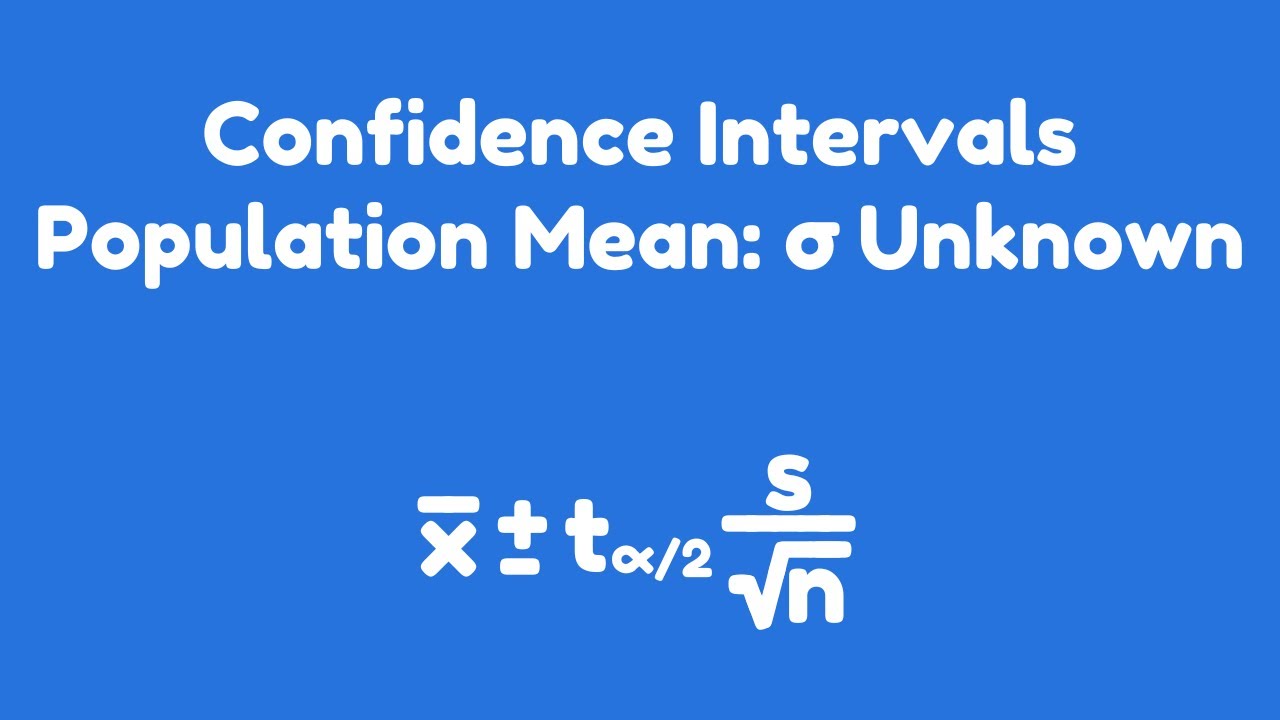
- 🔍 When the population standard deviation (σ) is unknown, the confidence interval for the population mean can be computed using the sample standard deviation (s) and a t-distribution.
- 📝 The formula for the margin of error in the confidence interval is derived from the t-value, sample standard deviation, and the square root of the sample size.
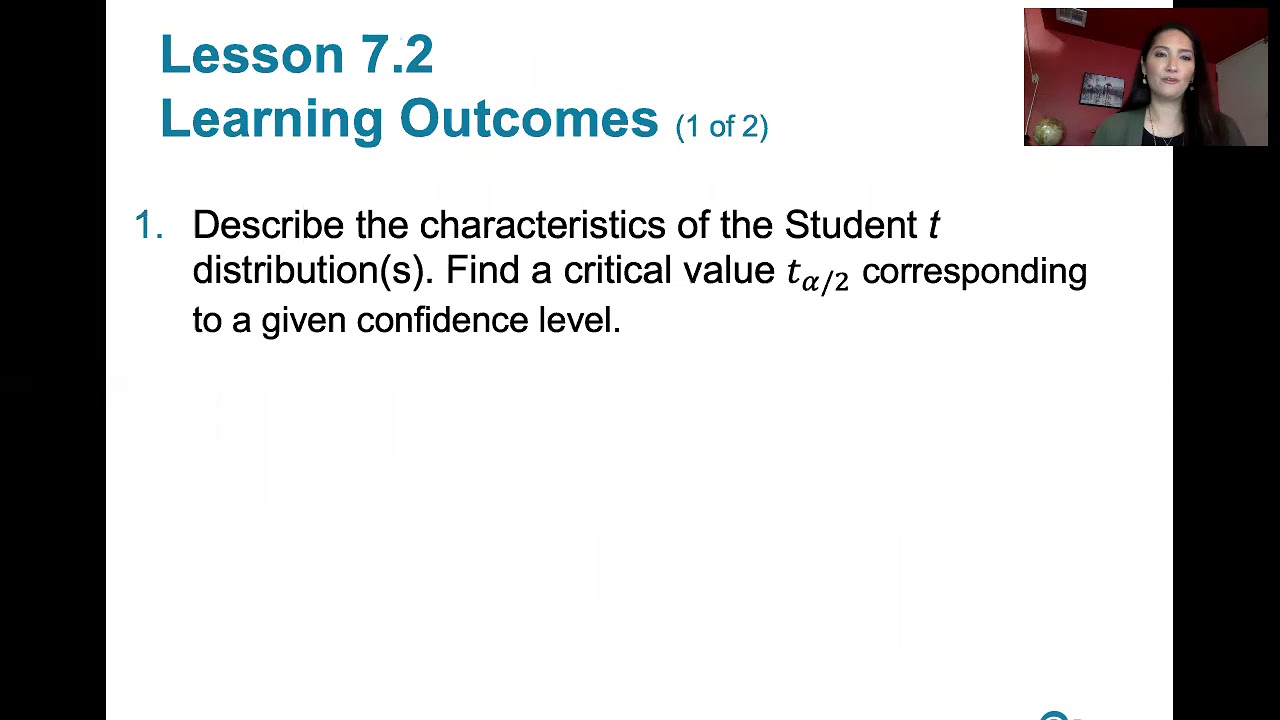
- 📉 The t-value depends on the sample size and the desired level of confidence, reflecting the critical value from the t-distribution.
- 🔢 To construct a confidence interval, requirements such as a simple random sample and an approximately normal sampling distribution of the sample mean must be met.
- 🔍 The confidence level (e.g., 95%) determines the amount of probability in the tails of the distribution, which affects the width of the confidence interval.
- 📝 The margin of error can be interpreted as the range within which the sample mean is likely to fall around the population mean, with a certain level of confidence.
- 🔢 An example in the script demonstrates how to calculate a 95% confidence interval for a set of DNA base codes, including computing the sample mean, standard deviation, and critical t-value.
- 🚫 Despite the example, the script notes that the confidence interval calculated for nominal data such as DNA base codes does not have practical use, as these numbers do not represent a measurable quantity.
Q & A
What is the main topic discussed in the video?
-The main topic discussed in the video is estimating the population mean using a point estimate and a confidence interval, particularly when the population standard deviation is unknown.
Why is the sample mean considered the best point estimate of the population mean?
-The sample mean is considered the best point estimate of the population mean because it is an unbiased estimator, meaning that its expected value is equal to the population mean, and it is also a consistent estimator, indicating that its standard deviation tends to be smaller than other measures of center, making it more reliable as a point estimate.
What is the formula used to compute the margin of error in a confidence interval for the population mean when the population standard deviation is unknown?
-The margin of error is computed using the formula: Margin of Error = t(α/2) * (s / √n), where t(α/2) is the critical t-value based on the desired confidence level and degrees of freedom, s is the sample standard deviation, and n is the sample size.
What is the purpose of the confidence interval for the population mean?
-The purpose of the confidence interval is to provide a range within which the true population mean is likely to fall with a certain level of confidence, allowing for estimation when the actual population mean is unknown.
How does the sample size affect the critical t-value in the margin of error formula?
-The critical t-value, which is used in the margin of error formula, depends on the sample size because different sample sizes correspond to different student t-distributions, reflecting the variability in the sampling distribution of the sample means.
What is the significance of the confidence level in constructing a confidence interval?
-The confidence level determines the degree of certainty associated with the confidence interval. For example, a 95% confidence level indicates that if the interval is constructed many times, the true population mean will fall within the interval 95% of the time.
What are the requirements for constructing a confidence interval for the population mean?
-The requirements for constructing a confidence interval include having a simple random sample and ensuring that the sampling distribution of the sample mean is approximately normal, which can be achieved if the original population is normally distributed or if the sample size is large enough (typically n > 30).
How can you interpret the margin of error in the context of a confidence interval?
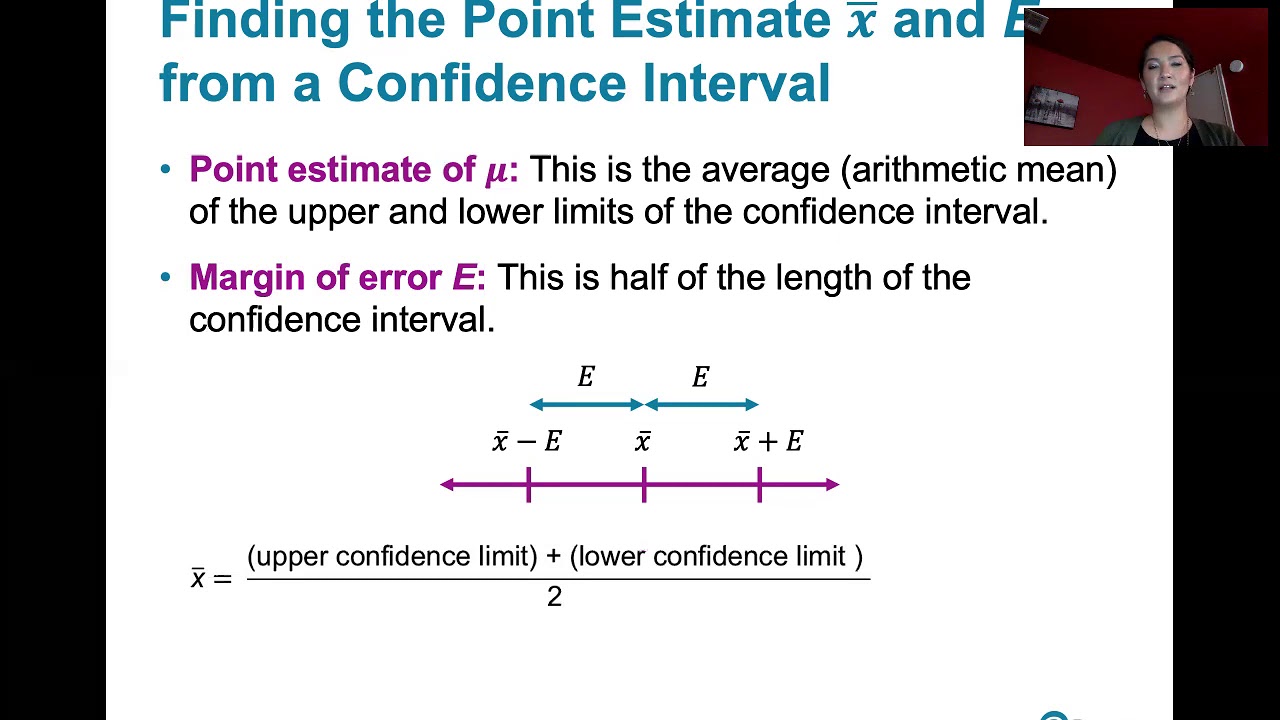
-The margin of error represents the range of values above and below the sample mean within which the true population mean is expected to lie with a certain level of confidence. It indicates the precision of the point estimate.
What is the practical use of a confidence interval in real-world applications?
-In real-world applications, a confidence interval provides an estimate of a population parameter, such as the mean, with a specified level of confidence. It is useful in research, surveys, and data analysis to make inferences about the population based on sample data.
Can you construct a confidence interval for a nominal variable like the DNA base codes in the example provided?
-While the process of constructing a confidence interval can be applied to any set of numerical data, including nominal variables like DNA base codes, the interpretation of such an interval would not be meaningful unless the numbers represent a measurable quantity. In the case of nominal data, the confidence interval does not provide any practical insights about the population.
Outlines
📊 Estimating Population Mean with Confidence Intervals
This paragraph introduces the concept of estimating the population mean using a point estimate and a confidence interval. It emphasizes that the sample mean (x-bar) is the best point estimate for the population mean due to its properties as an unbiased estimator. The paragraph also explains the process of calculating the margin of error for a confidence interval when the population standard deviation is unknown, highlighting the importance of the sample size and the confidence level in determining the error. The formulas for the confidence interval are reiterated, and the concept of the sampling distribution of sample means is introduced as the basis for the confidence interval calculation.
🔍 Understanding the Unbiased and Consistent Estimator
The second paragraph delves deeper into why the sample mean is considered the best point estimate of the population mean. It discusses the unbiased nature of the sample mean, meaning that its expected value is equal to the population mean. The paragraph also touches on the concept of consistency, which refers to the sample mean's reduced variability compared to other measures of central tendency. The summary explains that a consistent estimator has a smaller standard deviation in its sampling distribution, making it a more reliable estimator as the sample size increases.
📉 Interpreting the Margin of Error in Confidence Intervals
This paragraph focuses on the interpretation of the margin of error within the context of constructing a confidence interval for population means. It describes the process of determining the most likely values of the sample mean (x-bar) and how these values relate to the population mean. The explanation includes rearranging the inequality to place the population mean in the center, which allows for the calculation of the confidence interval. The paragraph also clarifies the meaning of confidence levels and how they relate to the probability that the true population mean falls within the calculated interval.
📝 Requirements for Constructing a Confidence Interval
The fourth paragraph outlines the prerequisites for constructing a confidence interval when the population standard deviation is unknown. It stresses the importance of having a simple random sample and ensuring that the sampling distribution of the sample mean is approximately normal, which can be achieved if the original population is normally distributed or if the sample size is large enough (n > 30). The paragraph also details the steps involved in computing the confidence interval, including identifying the necessary components such as the sample mean, sample standard deviation, sample size, and degrees of freedom.
🧬 Example of Constructing a Confidence Interval for DNA Base Codes
In this paragraph, an example is provided to illustrate the process of constructing a 95% confidence interval using a set of numerical data representing DNA base codes. The example guides through checking the requirements for constructing the interval, computing the sample mean and standard deviation, determining the critical t-value, and calculating the margin of error. It concludes with the calculation of the upper and lower bounds of the confidence interval and a brief discussion on the practical use of the interval in the context of the data provided.
🔬 Reflecting on the Practical Use of Confidence Intervals
The final paragraph reflects on the practical application of the confidence interval constructed in the example. It points out that while the exercise was valuable for practicing the method, the actual data used (DNA base codes) does not lend itself to meaningful statistical analysis in this context. The paragraph concludes by emphasizing the importance of understanding when and how to apply statistical techniques appropriately, acknowledging that the confidence interval, in this case, has no practical use due to the nature of the data.
Mindmap
Keywords
💡Point Estimate
💡Confidence Interval
💡Population Mean (μ)
💡Sample Mean (x̄)
💡Standard Deviation
💡Margin of Error
💡Critical t-value
💡Sampling Distribution
💡Unbiased Estimator
💡Consistent Estimator
💡Degrees of Freedom
Highlights
The video discusses learning outcome number two for lesson 7.2, focusing on estimating the population mean using a point estimate and confidence interval.
Explains why the sample mean is the best point estimate of the population mean when the population standard deviation is unknown.
Presents formulas for computing the confidence interval for the population mean when the population standard deviation is not known.
Describes the error in the confidence interval as related to the standard deviation of the sampling distribution of the sample means and the desired confidence level.
Details the computation of the error using the critical t-value, sample standard deviation, and square root of the sample size.
Discusses the unbiased nature of the sample mean as an estimator, with its expected value being the population mean.
Explains the concept of a consistent estimator and how the sample mean's standard deviation is smaller than other measures of center, indicating less variation.
Introduces the process of interpreting the margin of error in the context of the sampling distribution of sample means.
Demonstrates how to construct a confidence interval for population means using the sample mean, margin of error, and the critical t-value.
Outlines the requirements for constructing a confidence interval, including having a simple random sample and an approximately normal sampling distribution of the sample mean.
Provides a step-by-step guide on how to compute the sample mean and sample standard deviation for constructing a confidence interval.
Shows how to find the critical t-value using a t-distribution table or technology for given confidence level and degrees of freedom.
Illustrates the calculation of the margin of error using the critical t-value, sample standard deviation, and sample size.
Presents an example of constructing a 95% confidence interval for the mean of DNA base codes, assuming the requirements for the interval are met.
Discusses the practical use of a confidence interval and its interpretation in terms of the likelihood that the true population mean lies within the interval.
Concludes with the observation that while the example with DNA base codes may not have practical use, the exercise is valuable for practicing the construction of confidence intervals.
Transcripts
Browse More Related Video
Confidence Intervals | Population Mean: σ Unknown
7.2.3 Estimating a Population Mean - Finding X-Bar and Margin of Error, Given a Confidence Interval
7.2.4 Estimating a Population Mean - Sample Size for a Desired Margin of Error and Confidence Level

Confidence Interval for a population proportion | Solved Problems
7.2.0 Estimating a Population Mean - Lesson Overview, Key Concepts, Learning Outcomes

Finding a confidence interval given summary sample data
5.0 / 5 (0 votes)
Thanks for rating: