Correlation and Regression Analysis: Learn Everything With Examples
TLDRThe video script delves into the application of statistics to ascertain relationships between variables, with a focus on correlation and regression analysis. It explains that correlation measures the strength of association between variables, which can be positive or negative, and is quantified by a correlation coefficient (r) that ranges from -1 to 1. The script provides a step-by-step guide on calculating the correlation coefficient using Excel and interpreting the results, highlighting a strong relationship with a coefficient of 0.96. Regression analysis is introduced as a method to establish a functional relationship between variables for predictive purposes. The script outlines how to perform regression analysis in Excel, including interpreting the Summary Output, with emphasis on R Square for model fit, Significance F and P-values for reliability, and the regression equation for forecasting. The distinction between correlation, which assesses association strength, and regression, which predicts future outcomes, is clarified, emphasizing their complementary roles in statistical analysis.
Takeaways
- 📈 **Correlation Definition**: Correlation is a statistical term that describes the strength and direction of a relationship between two variables.
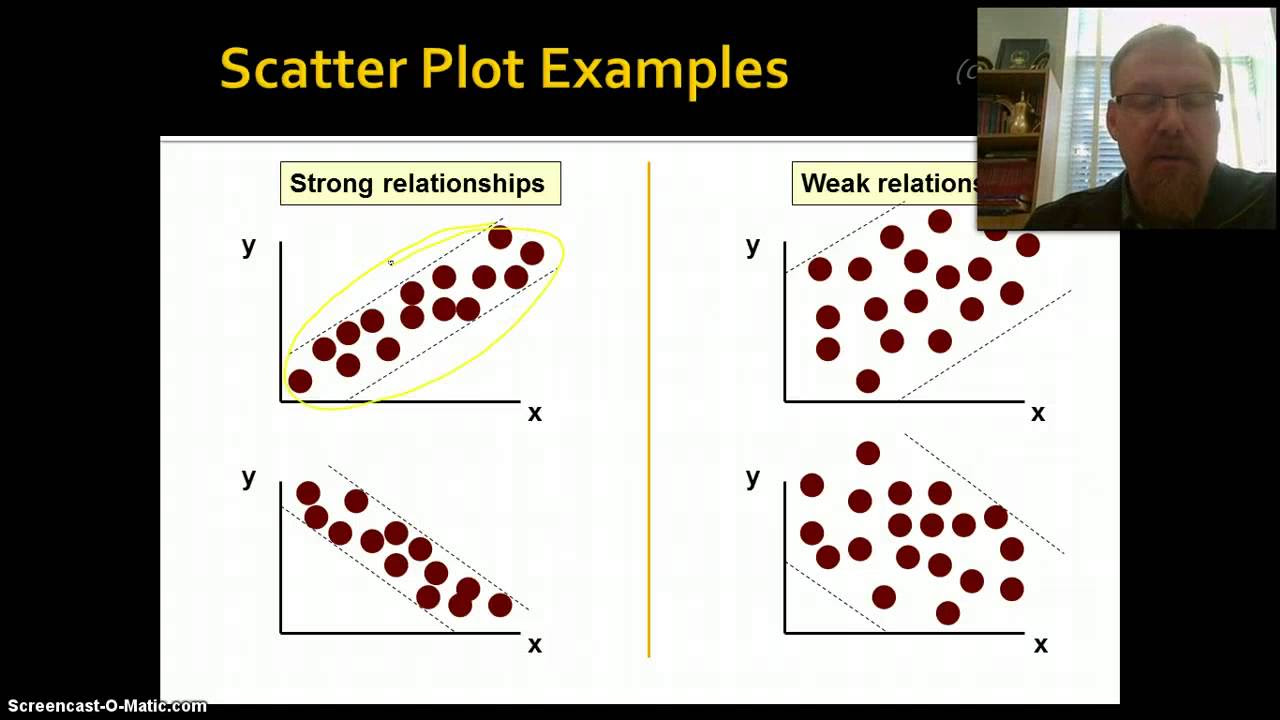
- 🔍 **Detecting Relationships**: Scatter plots can help detect relationships between variables, but not all relationships are obvious and may require statistical analysis.
- ➡️ **Positive vs Negative Correlation**: Variables are positively correlated if they move in the same direction and negatively correlated if they move in opposite directions.
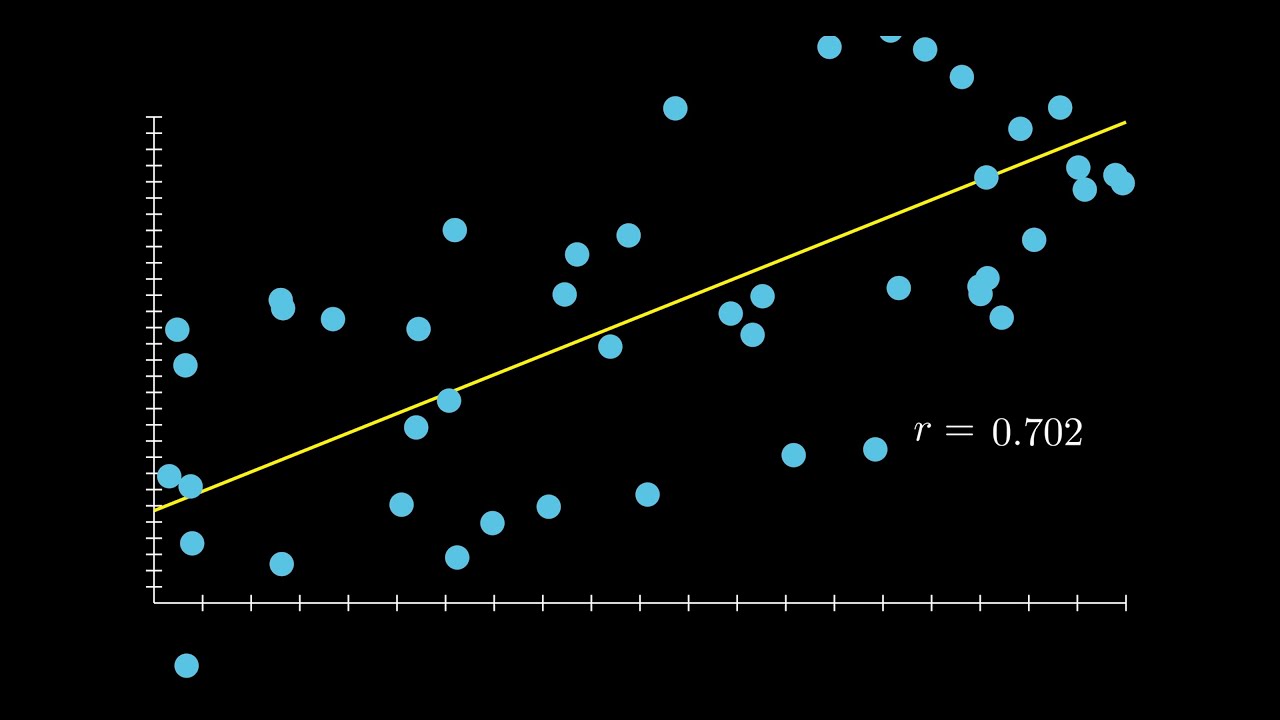
- 📊 **Correlation Coefficient (r)**: Measures the degree of association between variables, ranging from -1 (perfect negative correlation) to +1 (perfect positive correlation), with 0 indicating no correlation.
- 📋 **Calculating Correlation in Excel**: The CORREL function and Analysis Toolpak can be used to calculate the correlation coefficient in Excel.
- 📉 **Regression Analysis**: Describes the relationship between a dependent variable (y) and one or more independent variables (x), often represented by a regression equation.
- 🧮 **Regression Equation**: A simple equation that can be used to predict the value of y based on the value of x, typically visualized as a line on a scatter plot.
- 📊 **R Square Value**: Represents the proportion of variance in the dependent variable that is predictable from the independent variable(s).
- ✅ **Statistical Significance**: Significance F and P-values are used to determine if the regression results are reliable, with a common threshold of P < 0.05.
- 📝 **Coefficients in Regression**: The slope and intercept of the regression line, which indicate how the dependent variable changes with the independent variable.
- 📊 **Residuals in Regression**: The difference between the actual and predicted values, which can be used to assess the accuracy of the regression model.
- 🔮 **Applications of Correlation and Regression**: Correlation is used to assess the strength of relationships, while regression is used for making predictions and understanding the nature of the relationship between variables.
Q & A
What is the main purpose of using a scatter plot to analyze the relationship between two variables?
-The main purpose of using a scatter plot is to visually detect the relationship between two variables by observing the trend of the data points. It helps to identify whether there is a correlation and the nature of that correlation (positive, negative, or no correlation).
How does the term 'correlation' relate to the statistical analysis of variables?
-Correlation refers to a statistical technique that measures the strength and direction of the relationship between two variables. It indicates whether the variables move together (positive correlation), move in opposite directions (negative correlation), or show no clear connection (no correlation).
What is the correlation coefficient, and what does its value range represent?
-The correlation coefficient, denoted by 'r', is a measure of the linear association between two variables. It ranges from -1 to 1, where +1 indicates a perfect positive correlation, 0 indicates no correlation, and -1 indicates a perfect negative correlation.
How can Microsoft Excel be used to calculate the correlation coefficient between two variables?
-In Excel, you can calculate the correlation coefficient using two methods: 1) Using the CORREL function by selecting the two columns of data for the variables and pressing Enter, or 2) Using the Analysis Toolpak add-in, which allows you to generate correlation coefficients between multiple variables.
What is the significance of the regression analysis in understanding the relationship between variables?
-Regression analysis establishes a functional relationship between a dependent variable (y) and one or more independent variables (x). It allows for the prediction of the dependent variable based on the value of the independent variable and is used for making future projections or understanding the impact of one variable on another.
How is the regression equation used to construct a regression line on a scatter diagram?
-The regression equation, which represents the average change in the dependent variable (y) for a given change in the independent variable (x), is used to plot a line on a scatter diagram. This line, known as the regression line, provides a visual representation of the relationship between the variables and can be used for predictions.
What does the R Square value in a regression analysis indicate?
-The R Square value, also known as the coefficient of determination, indicates the proportion of the variance in the dependent variable that is predictable from the independent variable(s). A value closer to 1 suggests a better fit of the regression line to the data.
How are Significance F and P-values used to assess the reliability of regression analysis results?
-Significance F and P-values are used to determine the statistical significance of the regression model. A Significance F value less than 0.05 indicates that the model is statistically significant. P-values for individual coefficients should also be below 0.05, suggesting that those variables are significantly contributing to the model.
What is the interpretation of the coefficients in a regression equation?
-The coefficients in a regression equation represent the change in the dependent variable for a one-unit change in the independent variable. For example, if the equation is y = -159.474 + 30.088 * Temperature, it means that for each degree increase in temperature, ice cream sales increase by 30.088 units.
How can residuals be used to evaluate the accuracy of a regression model?
-Residuals are the differences between the actual data points and the predicted data points based on the regression equation. They show how far the observed values deviate from the values predicted by the model. Smaller residuals indicate a better fit of the model to the data.
What is the key difference between correlation and regression analysis?
-Correlation analysis is used to determine if there is a relationship between two variables and the strength of that relationship. Regression analysis, on the other hand, establishes a functional relationship between variables to make predictions or understand the impact of changes in one variable on another.
Why is it important to consider both positive and negative correlations in data analysis?
-Considering both positive and negative correlations is important because it provides a complete understanding of how variables are related. Positive correlation indicates that variables increase or decrease together, while negative correlation indicates they move in opposite directions. This knowledge is crucial for making accurate predictions and informed decisions.
Outlines
📈 Understanding Correlation and Its Calculation
This paragraph introduces the concept of correlation, which is a statistical measure of the relationship between two variables. It explains that correlation can be positive or negative, indicating whether the variables move in the same or opposite directions. The paragraph also describes how correlation is quantified using a correlation coefficient (r), which ranges from -1 to 1, with 0 indicating no correlation. The calculation of this coefficient is demonstrated using Microsoft Excel and Minitab, with two methods provided: using the CORREL function and the Analysis Toolpak add-in. An example using Temperature and Ice cream sales illustrates a strong positive correlation with a coefficient of 0.96.
📊 Regression Analysis and Its Application in Excel
The second paragraph delves into regression analysis, which is used to establish a functional relationship between two variables to make future predictions. It contrasts correlation, which is symmetrical and only measures the strength of association, with regression, which is asymmetrical and describes how one variable changes with respect to another. The paragraph outlines the steps to perform a regression analysis in Excel, from selecting the dependent and independent variables to interpreting the output, which includes the R Square value, Significance F and P-values, and the regression coefficients. The example of Temperature and Ice cream sales is used to demonstrate how regression can predict ice cream sales based on temperature, with the regression equation and its interpretation provided. The concept of residuals is also introduced to show the deviation of actual data points from predicted ones.
Mindmap
Keywords
💡Scatter Plot
💡Correlation
💡Correlation Coefficient
💡Positive Correlation
💡Negative Correlation
💡Regression
💡Regression Equation
💡R Square
💡Significance F and P-values
💡Coefficients
💡Residuals
Highlights
Scatter plots can be used to detect relationships between two or more variables by observing the trend of the plot.
Statistics can be used to comment on the relationship between variables when it's not obvious from the graph alone.
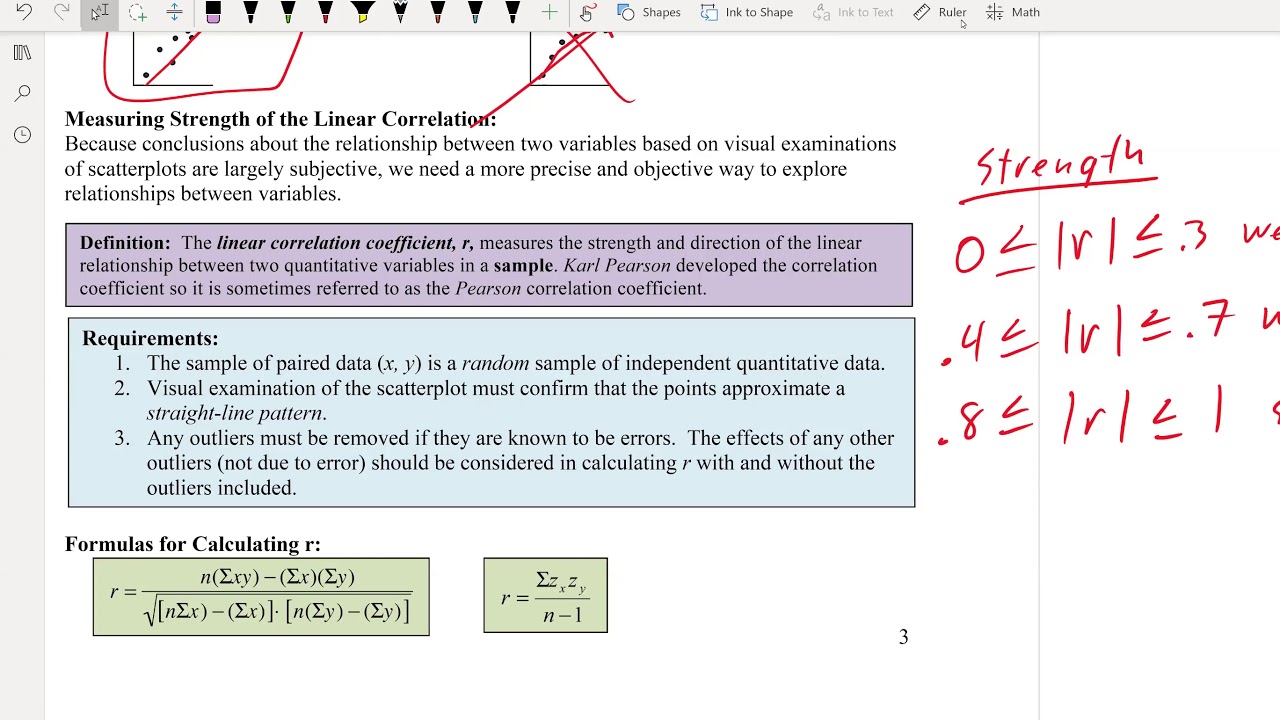
Correlation is a statistical technique representing the strength of the connection between pairs of variables.
Correlation can be positive (variables move in the same direction) or negative (variables move in opposite directions).
The correlation coefficient, denoted by r, measures the degree of association between two variables on a scale from -1 to 1.
+1 or -1 correlation indicates a complete linear relationship between variables, while 0 indicates no correlation.
Microsoft Excel and Minitab can be used to easily calculate the correlation coefficient.
Two methods in Excel: using the CORREL function or the Analysis Toolpak add-in.
Example: Correlation coefficient of 0.96 between Temperature of the day and Ice cream sales indicates a strong relationship.
Regression describes the strength of association between two variables and how one variable changes on average with a certain change in the other.
The regression equation represents how much the dependent variable (y) changes with a given change in the independent variable (x).
A regression line can be constructed on a scatter diagram to visualize the relationship between variables.
Excel can be used to perform regression analysis and interpret the Summary Output.
R Square measures the goodness of fit of the regression line, with values closer to 1 indicating a better fit.
Significance F and P-values are used to check the reliability of the regression results, with a threshold of 0.05.
The regression coefficients can be used to make predictions about the dependent variable based on the independent variable.
Residuals show the difference between the actual and predicted data points using the regression equation.
Correlation is used to determine if variables are related and the strength of their association, while regression is used for making future projections.
Transcripts
Browse More Related Video
Introduction to Correlation & Regression, Part 1
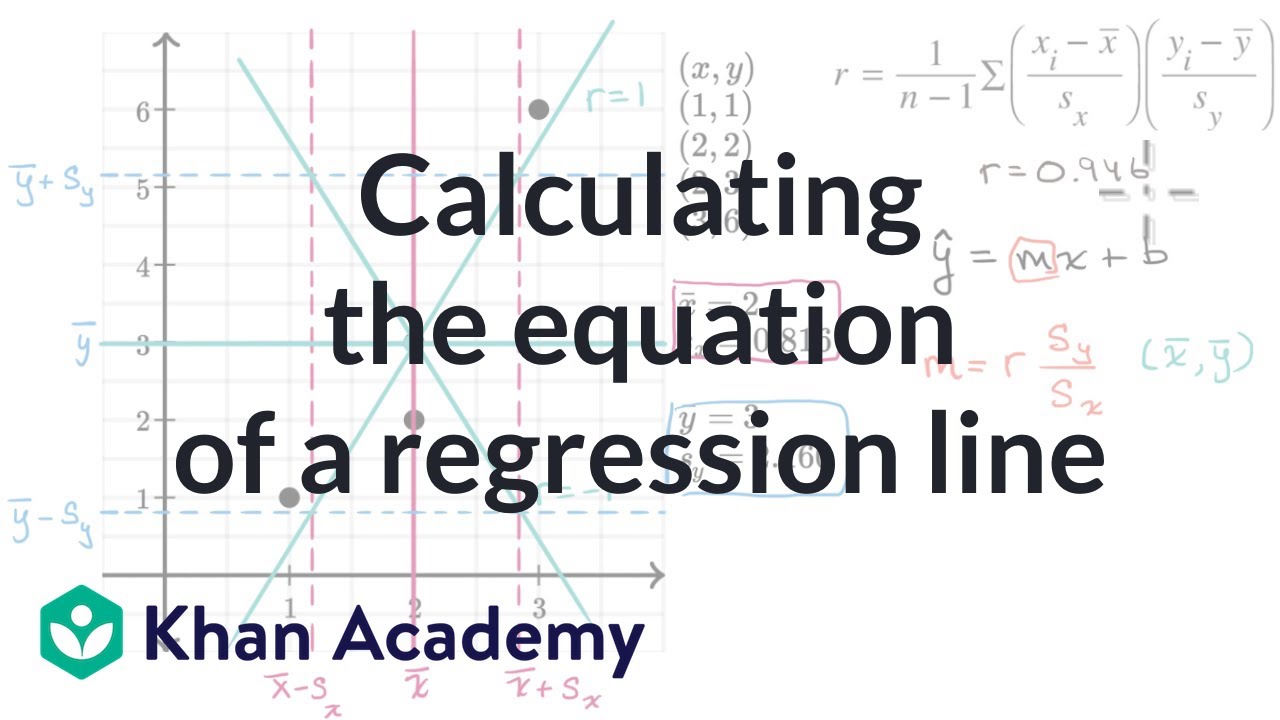
Calculating the equation of a regression line | AP Statistics | Khan Academy
Correlation and Coefficient of Determination in 3 Minutes
Math 119 Chapter 10 Part 1
10.2.1 Regression - Essential Terminology and Background Related to Regression

Elementary Stats Lesson #5
5.0 / 5 (0 votes)
Thanks for rating: