Math 119 Chapter 10 Part 1
TLDRThis instructional video script covers Chapter 10 on the concept of correlation, focusing on the linear relationship between two quantitative variables. It explains how to construct an equation to predict one variable from another, using real-world examples like beer consumption and blood alcohol levels. The script delves into response and explanatory variables, the significance of scatter plots, and the Pearson correlation coefficient (r) to measure the strength and direction of linear relationships. It also introduces hypothesis testing for correlation and the coefficient of determination (r-squared), concluding with practical applications and the importance of visual inspection for linearity before applying regression analysis.
Takeaways
- 📚 The lesson covers Chapter 10, focusing on the relationship and correlation between two variables, with the aim to construct an equation for prediction purposes.
- 📈 The concept of correlation is introduced, explaining how changes in one variable can be associated with changes in another, specifically looking for linear relationships between quantitative variables.
- 📊 The importance of identifying a response variable (outcome) and an explanatory variable (influence) is highlighted, using examples like beer consumption and blood alcohol content levels.
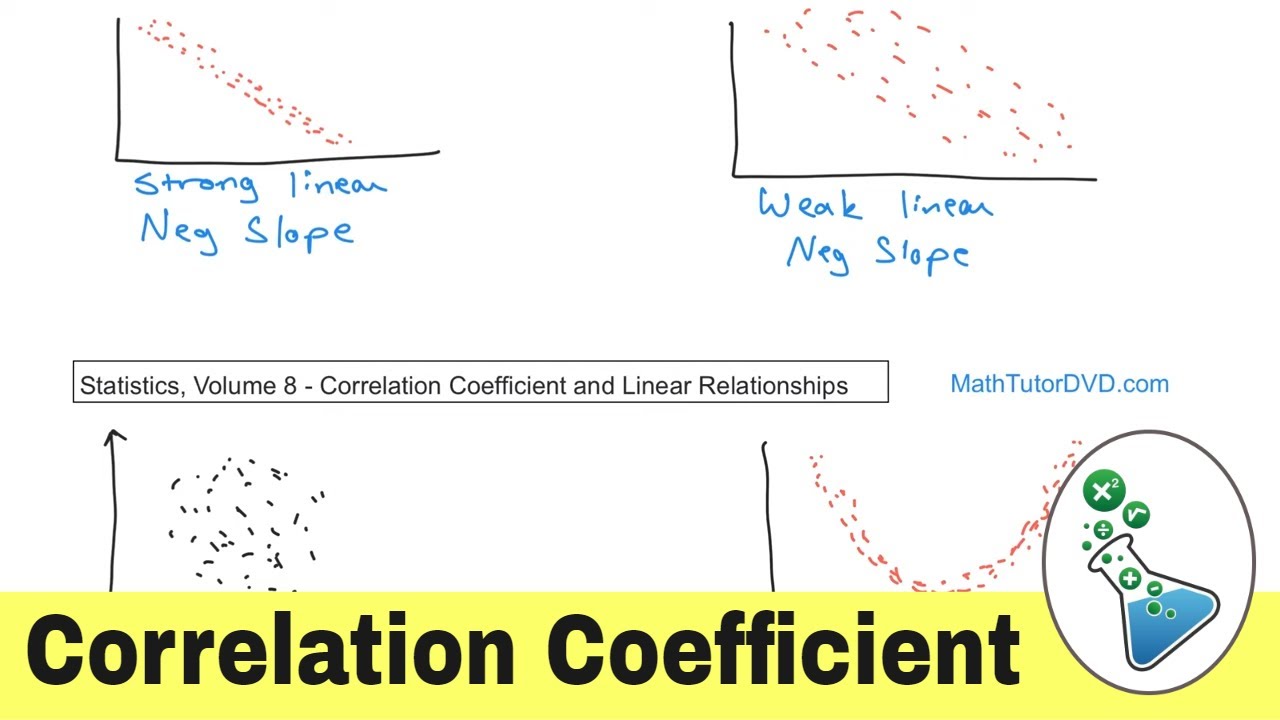
- 🧩 The script discusses the use of scatter plots to visualize potential correlations, differentiating between linear and non-linear relationships.
- 📉 The limitations of linear regression are noted, emphasizing that it should not be applied to non-linear relationships, as the technology might still provide a regression line even when it's not appropriate.
- 🔢 The Pearson correlation coefficient (r) is introduced as a statistical measure to quantify the strength and direction of a linear relationship between two variables.
- 📝 The script provides guidelines for interpreting the strength of a linear relationship based on the value of r, with ranges for weak, moderate, and strong correlations.
- 🤖 The use of technology, specifically calculators, is emphasized for calculating r and conducting hypothesis tests to determine the significance of the correlation.
- 📋 The process of conducting a hypothesis test for correlation is outlined, including stating the null and alternative hypotheses, selecting an alpha level, and interpreting the test statistic.
- 📊 The coefficient of determination (r squared) is explained as a measure of the proportion of variation in one variable that can be explained by the other variable.
- 🚀 The script concludes with practical examples and exercises to apply the concepts learned, such as analyzing the correlation between coffee prices and forest loss, and between the height and weight of supermodels.
Q & A
What is the main topic of Chapter 10 that the instructor is discussing?
-The main topic of Chapter 10 is the concept of correlation, specifically looking at the relationship between two quantitative numerical variables, constructing an equation to describe this relationship, and using it to predict one variable's value from the other.
What is the difference between a response variable and an explanatory variable?
-A response variable measures the outcome and is denoted by 'y', while an explanatory variable may explain or influence changes in the response variable and is represented by 'x'. The explanatory variable is often the cause or factor that influences the response variable.
What is a linear correlation and how is it represented visually?
-A linear correlation exists between two variables when there is a correlation and the plotted points of the paired results form a pattern that can be approximated by a straight line. This straight line is known as the line of best fit or regression line.
What is the significance of the Pearson correlation coefficient (r) in statistics?
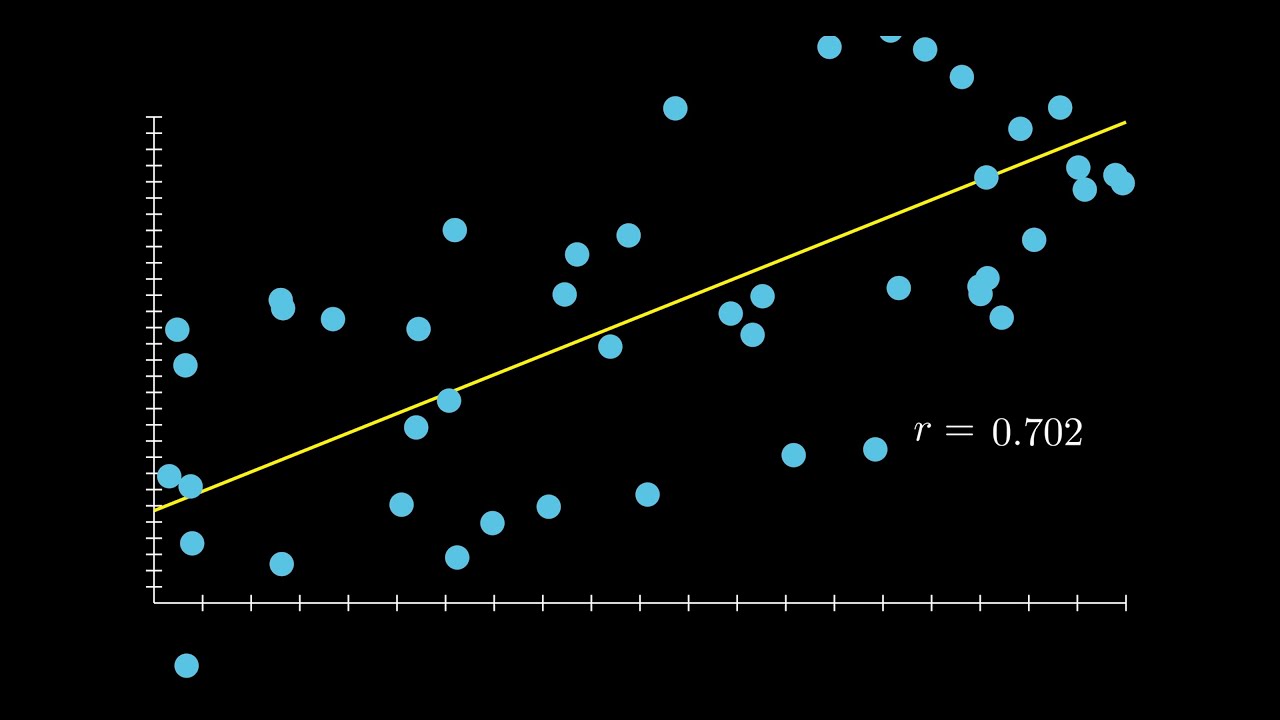
-The Pearson correlation coefficient (r) measures the strength and direction of a linear relationship between two variables. Its value ranges from -1 to 1, where values close to -1 or 1 indicate a strong linear relationship, and values around 0 indicate no linear relationship.
How is the strength of a linear relationship categorized based on the value of r?
-The strength of a linear relationship is categorized as follows: a weak linear relationship if the absolute value of r is between 0 and 0.3, a moderate linear relationship if it's between 0.3 and 0.7, and a strong linear relationship if it's between 0.7 and 1 or -0.7 and -1.
What is the purpose of a scatter plot in the context of correlation?
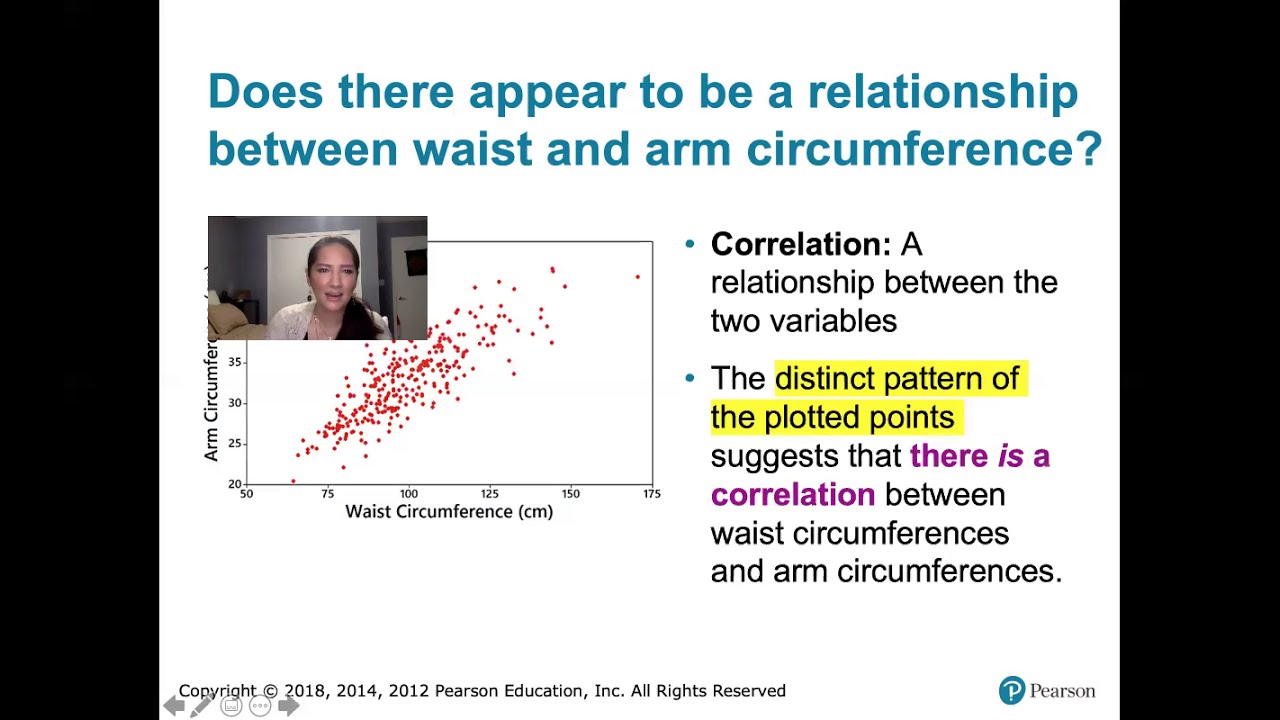
-A scatter plot is used to visually represent the relationship between two variables. It helps in identifying whether there is a linear or non-linear correlation, and the pattern of the points can indicate the strength and direction of the relationship.
Why is it important to visually inspect a scatter plot before calculating the correlation coefficient?
-Visual inspection of a scatter plot is important to ensure that the data points approximate a straight line pattern, which is a prerequisite for using the correlation coefficient. It helps in avoiding the misuse of correlation analysis on data that does not exhibit a linear relationship.
What is the role of the coefficient of determination (r squared) in statistical analysis?
-The coefficient of determination (r squared) represents the proportion of the variance in the dependent variable (y) that is predictable from the independent variable (x). It tells us what percentage of the variation in y can be explained by x.
Can you use linear regression analysis on data that does not appear to have a linear relationship?
-No, linear regression analysis should not be used on data that does not exhibit a linear relationship. Even though a calculator might still provide a regression line and related values, it is not appropriate or meaningful to apply linear regression in such cases.
What is the difference between using the correlation coefficient (r) and conducting a hypothesis test to determine a linear relationship?
-The correlation coefficient (r) provides a measure of the strength and direction of a linear relationship but does not directly test for statistical significance. A hypothesis test, on the other hand, allows you to determine if there is a statistically significant linear relationship between the variables, often using the p-value or comparing the t-value to critical values.
Outlines
📚 Introduction to Chapter 10: Correlation and Regression
The instructor begins by introducing Chapter 10, which focuses on the concept of correlation and regression analysis. It's explained that the chapter will cover the relationship between two variables, the construction of an equation to describe this relationship, and the use of this equation for prediction. The session will be divided into two parts due to the content's depth. The instructor emphasizes the importance of distinguishing between quantitative variables and introduces the concepts of response and explanatory variables using the example of blood alcohol content levels after drinking beer. The concept of correlation is explored, with a focus on linear correlation and the idea of a 'line of best fit' or regression line.
📈 Understanding Linear Correlation and Scatter Plots
This paragraph delves deeper into the concept of linear correlation, explaining how it is identified through scatter plots that approximate a straight line. The instructor discusses the subjectivity involved in determining the strength of a linear relationship visually, using examples of arm length versus height and oil production data. The importance of identifying the correct explanatory and response variables is highlighted, and the instructor provides guidelines for determining the strength of a linear relationship based on the Pearson correlation coefficient (r), ranging from weak to strong.
🔍 Exploring Non-Linear Relationships and Correlation Coefficients
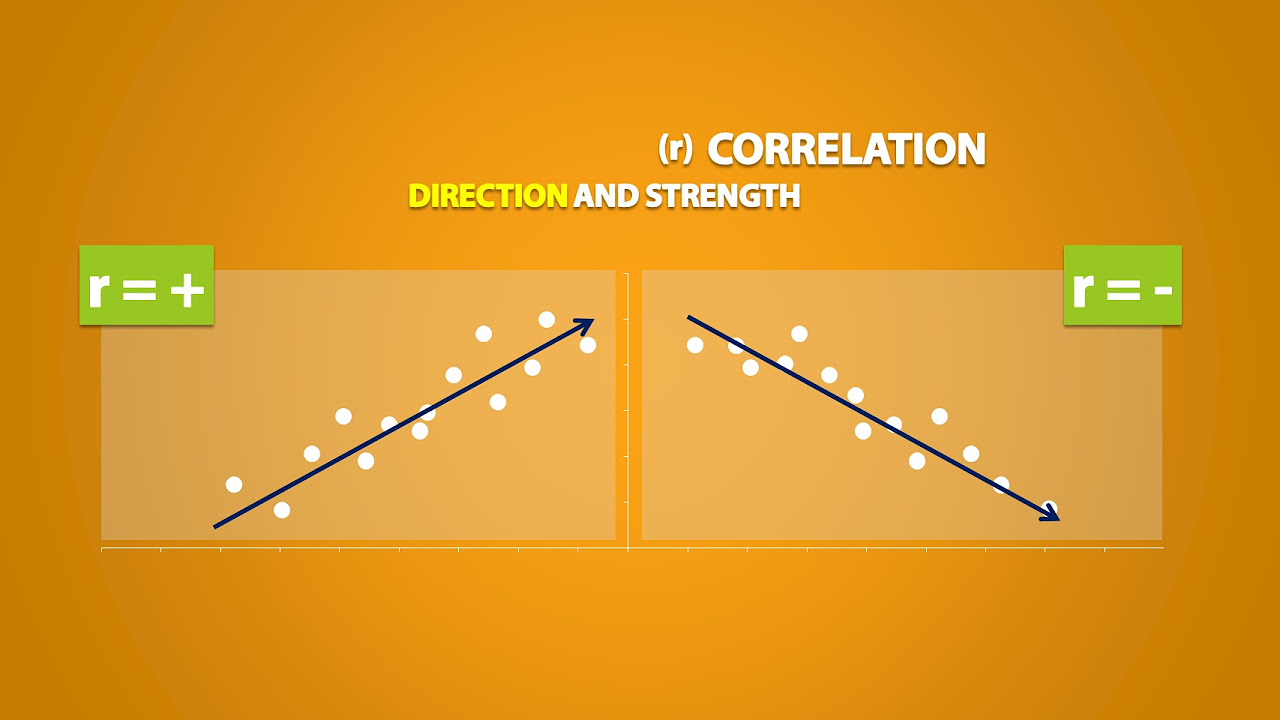
The instructor discusses the existence of non-linear relationships and the limitations of using linear regression for data that does not exhibit a linear form. The concept of positive and negative associations is introduced, along with the idea that the correlation coefficient (r) measures the strength and direction of a linear relationship but is not suitable for non-linear relationships. The paragraph also covers the properties of the linear correlation coefficient, including its range between -1 and 1, and its invariance to changes in units or variable assignments.
📝 Calculating and Interpreting the Linear Correlation Coefficient
This section provides an overview of how to calculate the linear correlation coefficient (r) using a calculator, emphasizing that the formula is complex and not required to be memorized. The instructor outlines the requirements for using the correlation coefficient, such as having a random sample of independent quantitative data and confirming a linear pattern through visual inspection. The importance of removing outliers due to errors and considering their effects when calculating r is also discussed.
📉 Hypothesis Testing for Linear Correlation
The instructor explains the process of hypothesis testing to determine if there is a significant linear correlation between two variables. This involves stating the null and alternative hypotheses, selecting an alpha level, and computing the test statistic using the correlation coefficient (r). The paragraph demonstrates how to use a calculator to perform a linear regression t-test and interpret the results, including the r value, t-value, and p-value.
🌋 Analyzing Data: Old Faithful Geyser Eruptions
Using data on the duration of Old Faithful geyser eruptions and the time interval until the next eruption, the instructor illustrates how to apply the linear regression t-test to determine if there is a significant linear correlation. The process involves entering the data into a calculator, performing the test, and comparing the calculated r value to a critical value from a correlation coefficient table to assess the strength of the relationship.
☕️ Coffee Prices and Deforestation: A Hypothesis Test
The instructor presents a scenario where the correlation between coffee prices and deforestation is examined using hypothesis testing. The steps include stating the null and alternative hypotheses, setting the alpha level, and calculating the test statistic using the t-value and p-value from a linear regression t-test. The results lead to the conclusion that there is a significant linear correlation between coffee prices and forest area lost.
📊 Interpreting R-Squared: Variation Explained by Linear Regression
The concept of r-squared, or the coefficient of determination, is introduced as a measure of how much of the variance in one variable can be explained by another variable through linear regression. The instructor explains that r-squared provides a percentage of the variation that is predictable, using an example of how weight affects fuel economy in cars. The importance of this metric in higher-level statistical analysis is highlighted.
🚗 Car Weight and Fuel Economy: Calculating R-Squared
In this final example, the instructor guides through the calculation of the correlation coefficient and r-squared using the heights and weights of supermodels to determine the percentage of weight variation that can be explained by height. The process involves entering the data into a calculator, performing a linear regression t-test, and interpreting the results to understand the strength of the relationship and the amount of variance explained.
🏁 Concluding Chapter 10 and Course Completion
The instructor wraps up the video by summarizing the key points covered in Chapter 10 and the entire course. The focus is on the importance of understanding correlation and regression analysis, the use of the Pearson coefficient, and the application of hypothesis testing in statistics. The instructor also mentions that the course will be concluded in the next video, signifying the end of the educational journey.
Mindmap
Keywords
💡Correlation
💡Linear Regression
💡Response Variable
💡Explanatory Variable
💡Scatter Plot
💡Pearson Coefficient (r)
💡Significance Level
💡Hypothesis Testing
💡R Squared (r²)
💡Critical Value
Highlights
Introduction to Chapter 10 focusing on the relationship and correlation between two variables.
Explanation of constructing an equation to predict one variable's value from another in a correlated relationship.
Differentiation between quantitative numerical variables and the concept of correlation.
Definition and identification of response and explanatory variables using the example of beer consumption and blood alcohol levels.
Discussion on the importance of scatter plots in visualizing potential correlations between variables.
Clarification on the linearity of correlation and the concept of the line of best fit or regression line.
The significance of the Pearson correlation coefficient (r) in measuring the strength and direction of a linear relationship.
Guidelines for determining the strength of a linear relationship based on the value of r.
Use of technology, specifically calculators, to find linear regression lines even in non-linear datasets.
The role of visual inspection in confirming the linearity of a relationship before applying linear regression.
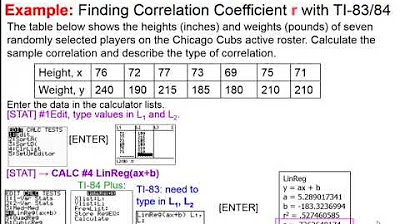
Procedure for calculating the linear correlation coefficient r using a calculator and its significance.
Hypothesis testing involving the correlation coefficient to determine the significance of a linear relationship.
The concept of r squared as the coefficient of determination, explaining the proportion of variation in one variable predictable from another.
Example of using the correlation coefficient to analyze the relationship between coffee prices and forest loss.
Demonstration of how to interpret r and r squared values using the heights and weights of supermodels as an example.
Final summary of Chapter 10, emphasizing the importance of understanding linear correlation and its applications.
Transcripts
Browse More Related Video
Elementary Statistics - Chapter 10 Correlation and Regression

Elementary Stats Lesson #5
10.1.1 Correlation - Linear, Nonlinear, Positive Linear, and Negative Linear Correlation Defined
Explanatory and Response Variables, Correlation (2.1)
Correlation and Coefficient of Determination in 3 Minutes
What is the Correlation Coefficient in Statistics?
5.0 / 5 (0 votes)
Thanks for rating: