Polar Equations & Graphs (Trigonometry/Precalculus) | Math with Professor V
TLDRThis instructional video delves into polar equations and their graphical representations, offering a valuable chart for reference. It explains how to graph lines, circles, cardioids, limacons, and roses in polar coordinates, highlighting the significance of theta and R values. The video guides viewers through identifying and plotting various polar equations, using tables of values and leveraging symmetry and trigonometric function properties. It emphasizes the importance of understanding the patterns and periodicity in polar graphs, providing step-by-step examples to illustrate the process.
Takeaways
- 📈 Polar equations are used to describe various geometric shapes in a polar coordinate system, where points are defined by their radius (R) and angle (theta) from the origin.
- 📚 The first chart in the video is a valuable reference for understanding different types of polar equations and their graphs.
- 📐 The polar equation for a line that makes an angle theta with the polar axis is given by theta equals alpha, where alpha is the angle with the positive x-axis.
- 📏 The equation for a vertical line in polar coordinates is R cosine theta equals a, and for a horizontal line, it's R sine theta equals b.
- 🔵 To graph a circle in polar coordinates, the equation R equals a is used, representing a circle centered at the origin with radius a.
- 🔶 The equations R equals plus or minus two a cosine theta and R equals plus or minus two a sine theta are used to graph circles centered on the x-axis and y-axis, respectively.
- ❤️ A cardioid is a shape that resembles a heart and is graphed using equations where the constant and the coefficient of sine or cosine are equal.
- 🍃 A Limaçon is a shape that can have an inner loop or not, depending on the relationship between the constant added to the trigonometric function and the coefficient of the function.
- ∞ The Lemniscate is a figure-eight shaped curve represented by equations of the form R squared equals a squared times (cosine 2 theta or sine 2 theta).
- 🌹 Roses are polar graphs with a specific number of petals, determined by the coefficient of theta in the equation, with odd coefficients indicating an odd number of petals and even coefficients doubling that number.
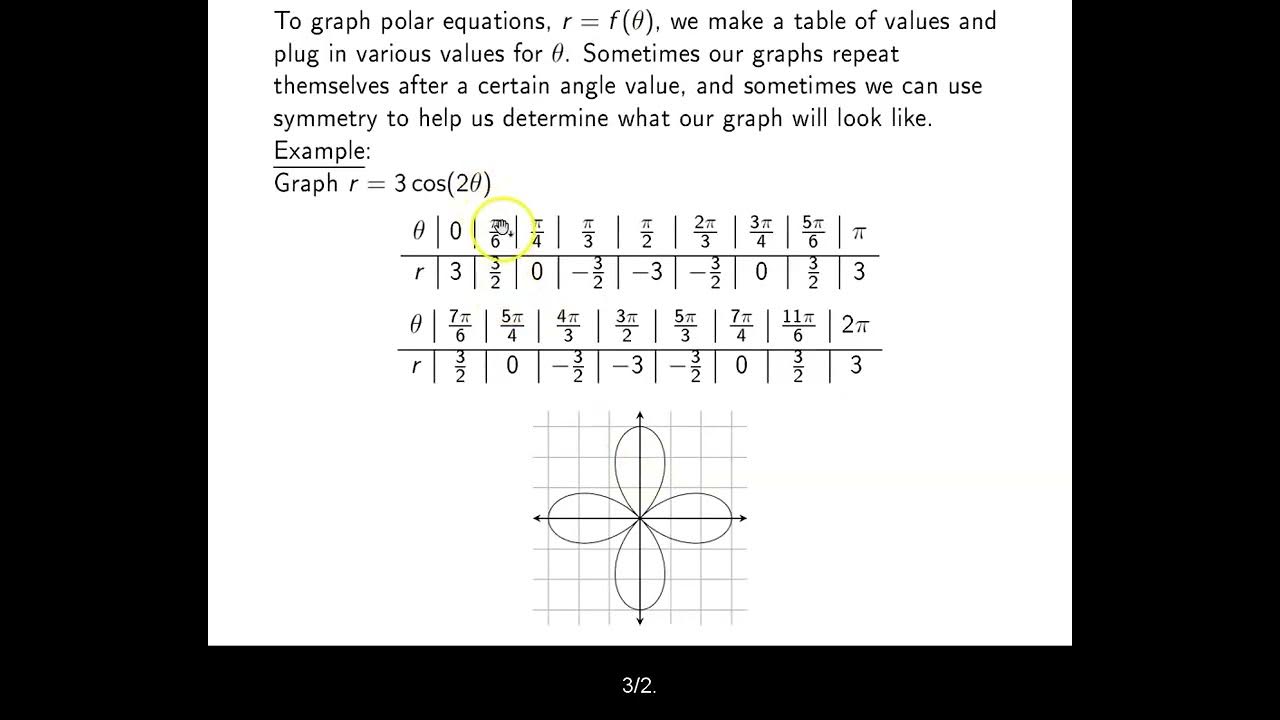
- 📊 Graphing polar equations involves creating a table of values for theta and the corresponding R, and plotting these points, often using symmetry and the periodic nature of trigonometric functions to fill in the graph.
Q & A
What is the main topic of the video?
-The main topic of the video is polar equations and how to graph them.
Why is the first chart recommended to be saved as a reference?
-The first chart is recommended to be saved as it provides a comprehensive list of different types of polar equations and their graphs, which is useful for understanding various polar equations.
How is the polar equation for a line that makes an angle theta with the polar axis written?
-The polar equation for a line making an angle theta with the polar axis is written as theta equals alpha, where alpha is the angle with the positive x-axis.
What is the polar equation for a vertical line in terms of R and theta?
-The polar equation for a vertical line is R cosine theta equals a, where 'a' is a constant.
How does the polar equation change when graphing a circle centered at the origin?
-When graphing a circle centered at the origin, the polar equation is R equals a, where 'a' is the radius of the circle, and there is no theta in the equation, allowing theta to take any value.
What is the characteristic of a cardioid in polar equations?
-A cardioid is characterized by a polar equation where the constant and the coefficient of the trigonometric function (sine or cosine) are equal.
What are the conditions for a polar equation to represent a Limaçon without an inner loop?
-A Limaçon without an inner loop is represented when the constant being added to the trigonometric function is different than the coefficient of the trigonometric function.
What is a Lemniscate and how can you identify it in polar equations?
-A Lemniscate is a figure-eight shaped curve and can be identified in polar equations when R squared is equal to a squared times either cosine of 2 theta or sine of 2 theta.
How can you determine the number of petals in a rose curve from its polar equation?
-The number of petals in a rose curve can be determined from the coefficient of theta in the polar equation. For an odd coefficient, the number of petals is equal to the coefficient, and for an even coefficient, the number of petals is double that value.
What is the significance of the coefficient in front of theta in a rose curve equation?
-The coefficient in front of theta in a rose curve equation determines the number of petals and the period of the curve. An odd coefficient results in an odd number of petals, while an even coefficient results in twice that number of petals.
How does the video suggest graphing the cardioid R = 1 + sin(theta)?
-The video suggests graphing the cardioid R = 1 + sin(theta) by making a table of values for different theta angles, substituting these values into the equation, and plotting them on a polar graph.
What is a useful strategy for graphing polar equations mentioned in the video?
-A useful strategy mentioned in the video for graphing polar equations is to first graph the corresponding rectangular equation (like y = 1 + sin(theta)) to help determine values for the table of values in the polar graph.
How does the video explain the graphing of a Limaçon with an inner loop?
-The video explains that a Limaçon with an inner loop occurs when 'a' is less than 'B' in the polar equation R = a - b * cos(theta) or R = a - b * sin(theta), and demonstrates the graphing process by creating a table of values for different theta angles.
What is the significance of the coefficient of theta in rose curves with respect to the period of the graph?
-The coefficient of theta in rose curves affects the period of the graph. If the coefficient is n, the period of the graph will be 2π/n, causing the graph to repeat more or less frequently depending on whether n is greater or smaller than 1.
How does the video demonstrate the graphing of a rose curve with 3 petals?
-The video demonstrates the graphing of a rose curve with 3 petals by using the equation R = 2 * sin(3 * theta), calculating values for different fractions of theta (such as theta/3), and plotting these on a polar graph to show the 3 petals.
What is the method suggested in the video to determine the tips of the petals in a rose curve?
-The video suggests determining the tips of the petals in a rose curve by identifying when the radius reaches its maximum value, which is the coefficient in front of the sine or cosine function in the polar equation.
How can the graph of y = 2 * sin(3 * theta) help in graphing the rose curve in polar coordinates?
-The graph of y = 2 * sin(3 * theta) can help in graphing the rose curve in polar coordinates by showing the amplitude and period of the sine function, which corresponds to the maximum radius and the repeating pattern of the rose curve, respectively.
Outlines
📚 Introduction to Polar Equations and Graphs
This paragraph introduces the concept of polar equations and their graphs, emphasizing the importance of a reference chart provided for different types of polar equations. It explains how to represent lines and circles in polar coordinates and highlights the uniqueness of polar equations for circles, which differ from their rectangular counterparts. The paragraph also touches on equations for circles centered along the x or y-axis, cardioids, and Limassol, and ends with a brief mention of roses, setting the stage for the examples to follow.
📈 Graphing a Cardioid with R = 1 + sin(θ)
The second paragraph delves into the process of graphing a cardioid using the polar equation R = 1 + sin(θ). It suggests using a table of values and leveraging existing knowledge of trigonometric functions to plot points. The speaker provides a step-by-step guide on how to calculate R for various θ values, starting from 0 to 2π, and explains the symmetry and periodic nature of the graph, which resembles an upside-down heart centered on the y-axis.
📉 Graphing a Limassol without an Inner Loop: R = 2 - cos(θ)
This paragraph focuses on graphing a specific type of Limassol curve, characterized by the equation R = 2 - cos(θ), which lacks an inner loop due to the constant being larger than the coefficient of the trigonometric function. The speaker outlines the method of creating a table with θ values and corresponding R values, and then plotting these points to reveal the shape of the graph, which is centered on the x-axis due to the presence of cos(θ).
🔄 Graphing a Limassol with an Inner Loop: R = 1 - 2sin(θ)
The fourth paragraph describes how to graph a Limassol curve with an inner loop using the equation R = 1 - 2sin(θ). The process involves filling in a table with θ values and calculating the corresponding R values, which are then plotted. The presence of an inner loop is indicated by the constant being less than the coefficient of the sine function. The speaker provides a detailed explanation of the calculations and the resulting graph, which includes an inner loop and an outer shape resembling a cardioid.
🌹 Graphing a Rose Curve: R = 2sin(3θ)
In this paragraph, the speaker discusses the graphing of a rose curve, a type of polar equation characterized by the equation R = 2sin(3θ), which indicates a rose with three petals due to the odd coefficient of θ. The explanation includes the need to use a smaller step size for θ to capture the entire graph due to the altered period of the sine function. The speaker walks through the calculation of R for various θ values and describes how to plot these to form the rose curve, emphasizing the tips of the petals where the radius reaches its maximum value.
🔍 Completing the Rose Curve and Additional Graphing Tips
The final paragraph wraps up the lesson on graphing polar equations by completing the rose curve and providing additional tips. The speaker fills in the remaining points to fully illustrate the rose curve and suggests using a graph of the sine function to assist in plotting points for polar graphs. The paragraph concludes with a reminder to take time and add as many points as necessary to achieve a clear and accurate graph.
Mindmap
Keywords
💡Polar Equations
💡Graphs
💡Theta (θ)
💡Radius
💡Cardioid
💡Limaçon
💡Lemniscate
💡Roses
💡Sine and Cosine
💡Table of Values
Highlights
Introduction to polar equations and their graphs with a recommendation to save the first chart for reference.
Explanation of polar equation for a line with angle theta with the polar axis and its representation as theta equals alpha.
Conversion of rectangular equation y = mx to polar form for graphing lines.
Identification of vertical and horizontal line equations in polar coordinates using R cos(theta) = a and R sin(theta) = b.
Description of polar equation for a circle centered at the origin with R = a.
Usefulness of polar coordinates in graphing circles without involving theta in the equation.
Method to graph a circle with center on the x-axis using R = ±2a cos(theta) and its relation to the diameter.
Graphing a circle with center on the y-axis using R = ±2a sin(theta) and the significance of sine theta.
Identification of cardioids by equal constants in front of and the constant of the trigonometric function.
Introduction to Limassol graphs and their distinction from cardioids based on the constants involved.
Explanation of the Lemniscate graph resembling an infinity sign with R^2 = a^2 cos(2theta) or sin(2theta).
Method to determine the number of petals in a rose graph based on the coefficient of theta.
Practical example of graphing a cardioid with R = 1 + sin(theta) using a table of values.
Technique to use the graph of y = 1 + sin(theta) to assist in plotting values for polar graphs.
Graphing a Limaçon without an inner loop using R = 2 - cos(theta) and its relation to the unit circle values.
Identification of a Limaçon with an inner loop using R = 1 - 2sin(theta) and its graphing method.
Fun aspect of graphing roses with R = 2sin(3theta) and determining the number of petals as 3.
Importance of adjusting the period and step size when graphing roses to capture the complete shape.
Conclusion emphasizing the importance of taking time and adding points to the table for accurate graphing.
Transcripts
Browse More Related Video
Ch. 8.2 Graphs of Polar Equations
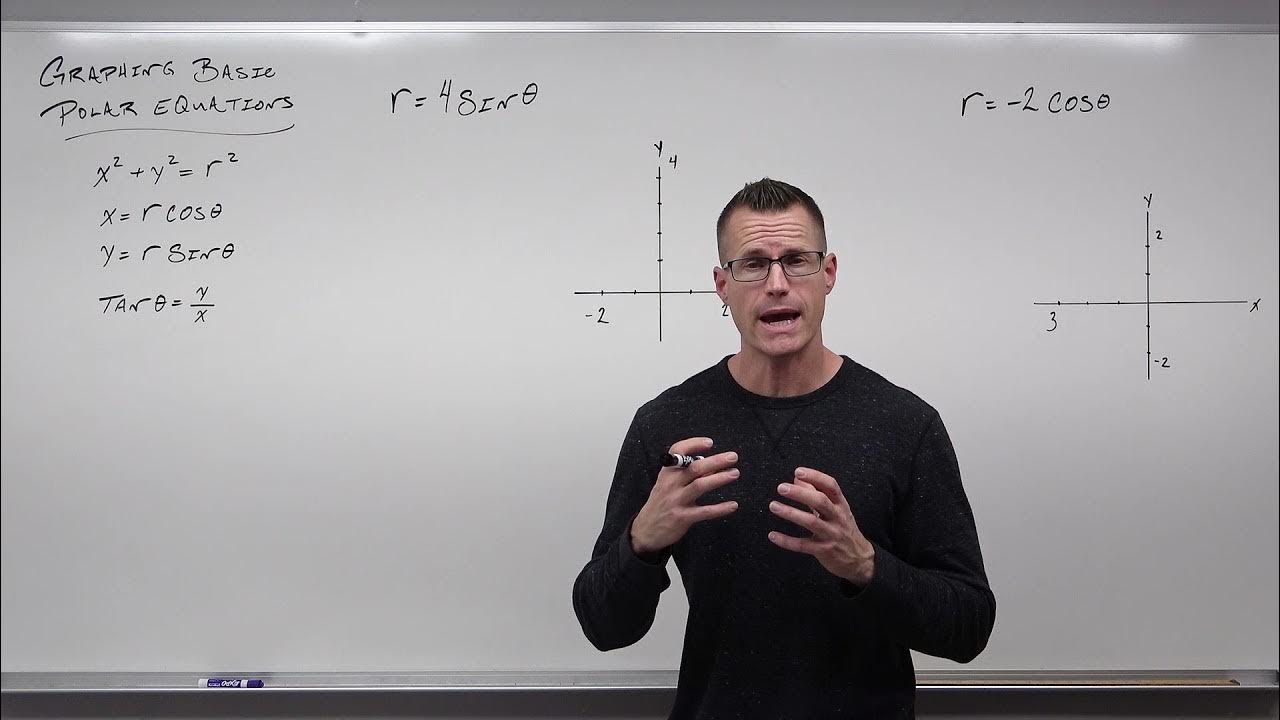
How to Graph Basic Polar Equations (Precalculus - Trigonometry 41)
Polar Curves
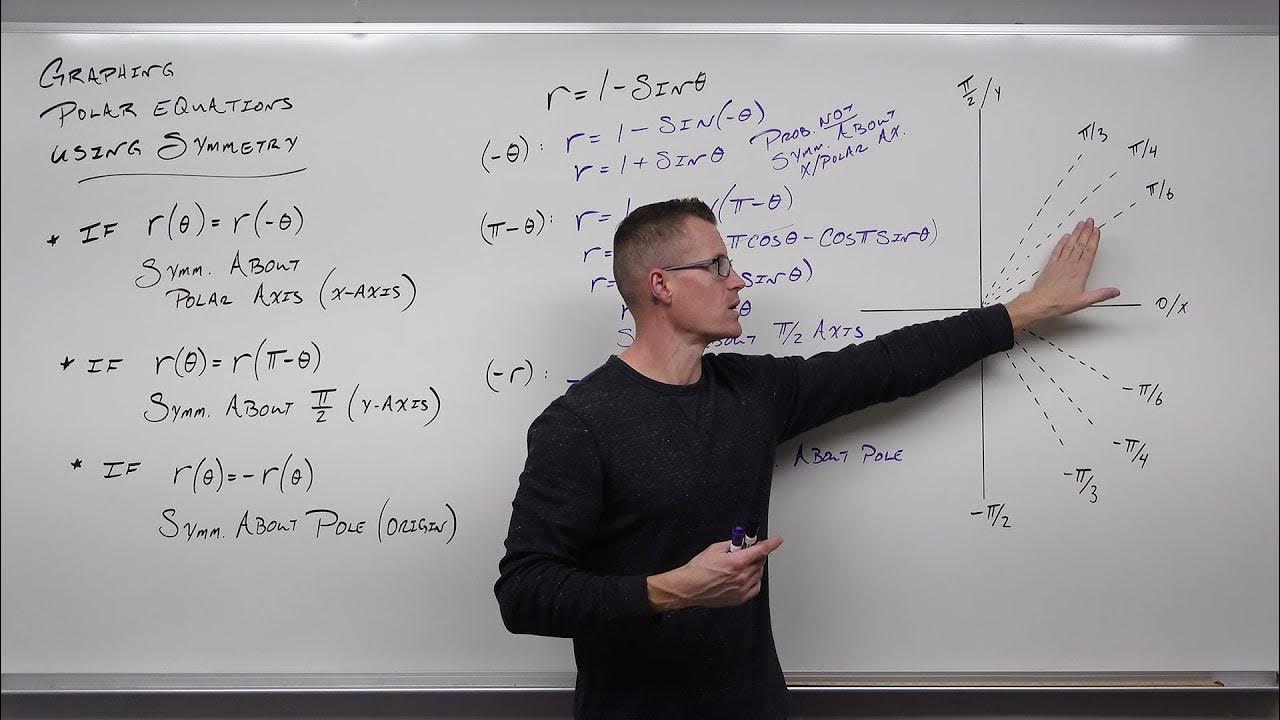
How to Graph Advanced Polar Equations with Symmetry (Precalculus - Trigonometry 42)

Calculus 2: Polar Coordinates (Video #30) | Math with Professor V
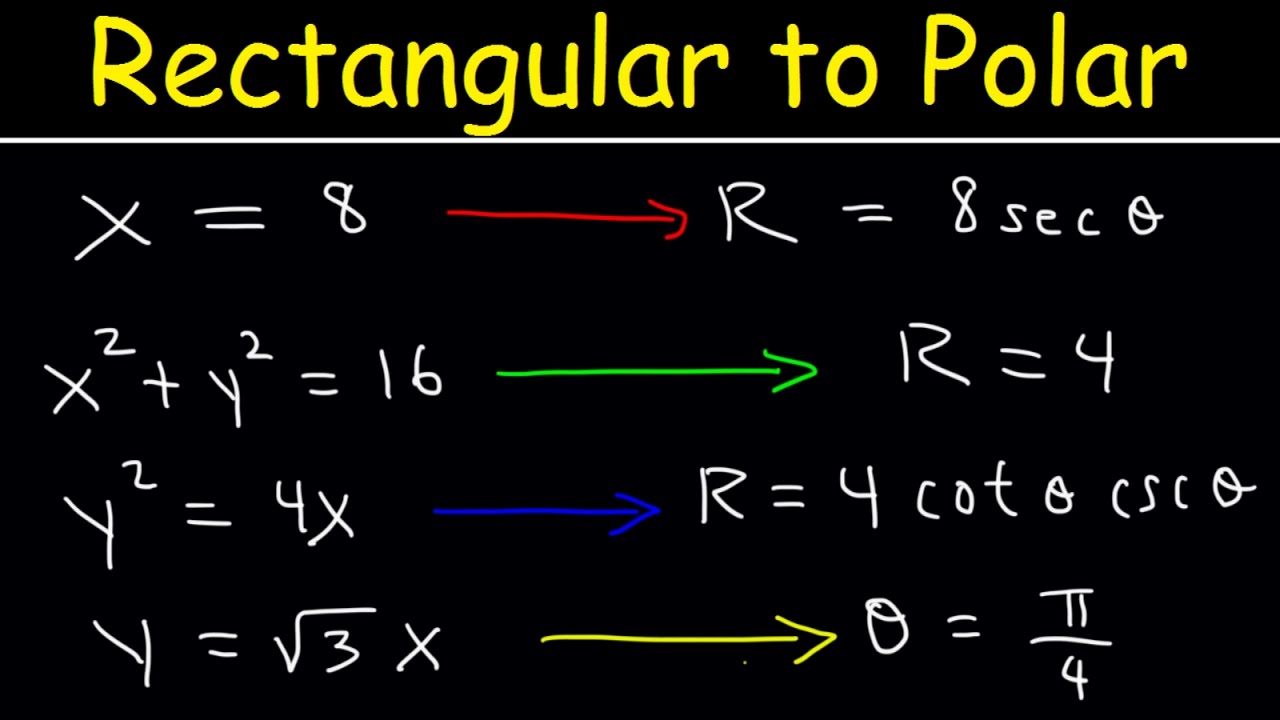
Rectangular Equation to Polar Equations, Precalculus, Examples and Practice Problems
5.0 / 5 (0 votes)
Thanks for rating: