How to Graph Advanced Polar Equations with Symmetry (Precalculus - Trigonometry 42)
TLDRThis video delves into the concept of symmetry in polar equations, emphasizing the importance of understanding how to identify and apply symmetry to simplify graphing complex polar equations. The host illustrates this with examples, showing how substituting values and analyzing symmetry can reveal the shape of the graph without needing to convert to rectangular coordinates. The video is a part of a series on trigonometry and polar coordinates, highlighting the practical application of symmetry in polar graphs and providing a methodical approach to tackle challenging equations.
Takeaways
- 📚 Start with the basics: Understanding symmetry in polar equations is crucial for simplifying the graphing process without converting to rectangular coordinates.
- 🔍 Check for symmetry: Evaluate the equation by substituting θ with -θ, π - θ, and -r to determine the type of symmetry (about the polar axis, y-axis, or pole).
- ✅ Even functions test: For cosine, which is an even function, substituting -θ will result in the same equation, indicating symmetry about the x-axis or polar axis.
- 🤔 Symmetry implications: If an equation shows symmetry about the polar axis or y-axis, it simplifies the graphing process by reducing the number of points you need to plot.
- 📈 Use sum and difference formulas: When checking for symmetry about the y-axis (π - θ), sum and difference formulas for trigonometric functions are essential.
- 📌 Points to plot: After checking for symmetry, plot points for common angles within the specified range to map out the graph.
- 🔄 Apply symmetry: Once you've plotted points and identified the symmetry, use it to 'mirror' the graph across the axis or pole, thus completing the graph with fewer plotted points.
- 💡 Limit your work: By leveraging symmetry, you can limit the number of points you calculate and plot, which is particularly useful for complex equations.
- 📉 Handle negative r values: When you encounter negative r values, it indicates symmetry about the pole, which means you'll plot points in both the positive and negative directions of the angle.
- 🌹 Identify specific curves: Recognize the shapes created by different polar equations, such as a cardioid (heart-shaped) or a lemniscate (figure-eight), which can help in graphing and understanding their properties.
- ⚙️ Practice makes perfect: The more you practice identifying symmetry and plotting points, the more efficient you'll become at graphing polar equations without the need for rectangular conversions.
Q & A
What is the main topic of the video?
-The main topic of the video is the discussion of symmetry in polar equations and how to use it to simplify the process of graphing these equations.
Why is it sometimes difficult to convert polar equations into rectangular equations?
-It can be difficult because some polar equations do not translate well into rectangular form and may become complex, hard to deal with, and not represent familiar shapes like circles or ellipses.
What is the significance of checking for symmetry in polar equations?
-Checking for symmetry allows you to identify axes or points about which the graph of the polar equation is symmetrical. This can significantly reduce the number of points you need to calculate and plot, making it easier to graph the equation.
How does the video demonstrate the concept of symmetry about the polar axis?
-The video demonstrates this by showing that if plugging in negative theta into the equation yields the same equation, the graph will be symmetric about the polar axis, acting like an even function.
What is a common mistake to avoid when graphing polar equations?
-A common mistake to avoid is attempting to convert every polar equation into a rectangular equation for graphing, as this can lead to unnecessary complexity and is not always necessary.
How does the video use the properties of sine and cosine functions to check for symmetry?
-The video uses the fact that sine is an odd function and cosine is an even function to predict the outcomes of substituting negative theta or pi minus theta into the equations, which helps determine the presence of symmetry.
What is a lemniscate, and how is it related to the polar equation r = 1 - sine theta?
-A lemniscate is a shape that resembles a figure-eight or a heart, and it is the graph that results from the polar equation r = 1 - sine theta. The video demonstrates that this equation is best left in polar form due to its complexity in rectangular form.
What is the strategy for graphing polar equations efficiently?
-The strategy involves checking for symmetry, plugging in the least number of points necessary (often just one quadrant), and then using the identified symmetry to mirror the graph across the appropriate axes or points.
Why is it important to identify symmetry about the pole in polar equations?
-Identifying symmetry about the pole allows you to understand that the graph will be mirrored across the pole (origin), which means you only need to graph the positive r values for a given angle, as the negative r values will be the mirror image.
How does the video illustrate the process of graphing the polar equation r = 1 + 2 cosine theta?
-The video illustrates this by first checking for symmetry, determining that there is symmetry about the polar axis, and then plugging in various theta values to find corresponding r values. It then uses this symmetry to graph the equation efficiently.
What is a rose in the context of polar equations, and how does the video demonstrate its creation?
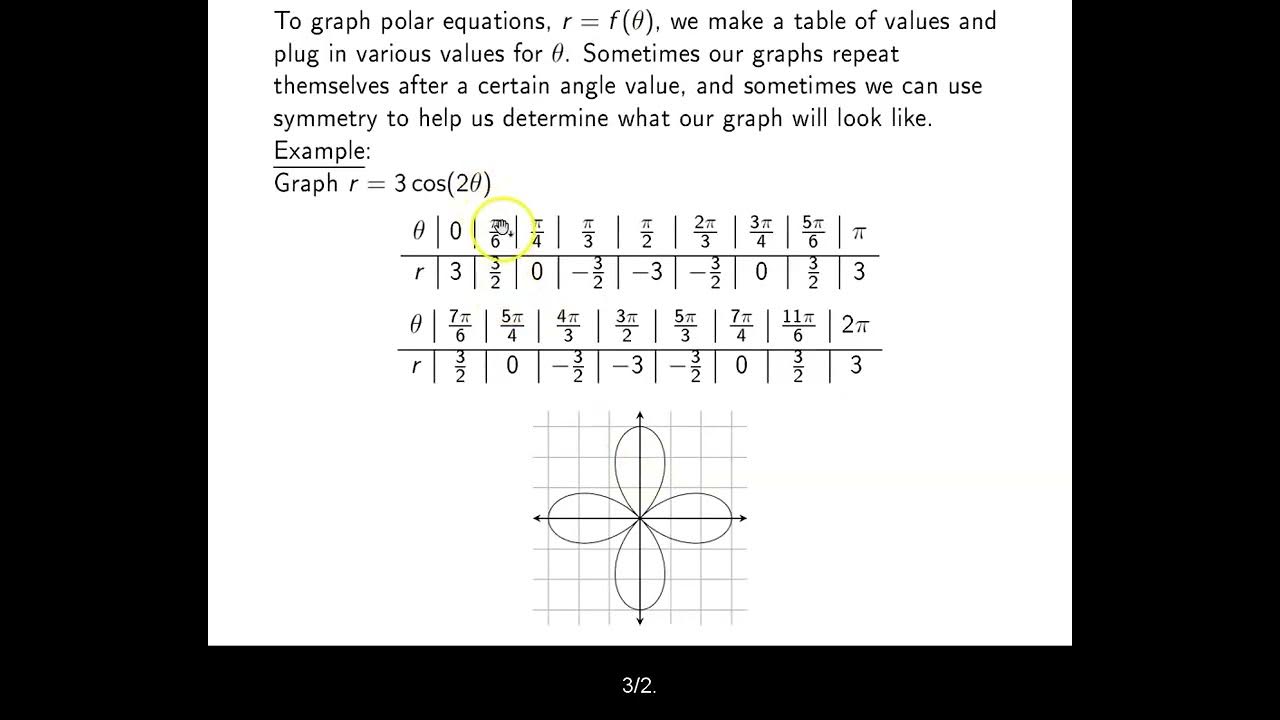
-A rose is a shape that can be created using polar equations, characterized by its petal-like structure. The video demonstrates the creation of a rose by plugging in values for theta and calculating r for the equation r = 2 cosine 2 theta, then using symmetry to complete the graph.
Outlines
📚 Introduction to Polar Equations and Symmetry
The video begins with an introduction to the topic of symmetry in polar equations. It emphasizes the complexity of converting certain polar equations into rectangular form and the importance of understanding symmetry to simplify the process. The presenter outlines the concept of symmetry about the polar axis, the x-axis, and the pole, and how recognizing symmetry can reduce the number of points needed to plot the graph of a polar equation.
🔍 Checking Symmetry in Polar Equations
This paragraph delves into the process of checking for symmetry in polar equations. It explains how to test for symmetry about the x-axis by substituting negative theta and observing if the equation remains unchanged. The presenter also discusses the implications of sine being an odd function and how it affects the symmetry of the graph. The importance of using sum and difference formulas to check for symmetry about the y-axis is highlighted.
🤔 Utilizing Symmetry to Simplify Graphing
The presenter explains how to use the identified symmetry to limit the number of points that need to be plotted for a polar graph. It demonstrates that by finding values from negative pi over 2 to pi over 2, one can use symmetry to deduce the rest of the graph. This approach is particularly useful for equations that are difficult to convert into rectangular form, such as r = 1 - sine theta, which results in a cardioid shape.
📈 Graphing with Symmetry: An Example
The paragraph provides a step-by-step example of graphing a polar equation using symmetry. It starts with the equation r = 1 + 2 cosine theta and shows that it is symmetric about the polar axis. The presenter then guides the viewer through plugging in various theta values, calculating the corresponding r values, and plotting these on the polar coordinate system. The use of symmetry about the x-axis is emphasized to simplify the graphing process.
🔧 Working with Negative r Values
This section addresses the challenge of graphing polar equations when negative r values are encountered. It explains the concept of going in the opposite direction of the angle when an r value is negative. The presenter illustrates this with examples, showing how to plot points and use the axis of symmetry to mirror the graph across the polar axis.
🌹 Creating a Rose Graph with Symmetry
The video introduces the concept of a 'rose' graph in polar coordinates, which is created through symmetry. It explains that if a polar equation has symmetry about both the x-axis and the y-axis, it will also have symmetry about the origin. The presenter demonstrates how to plot points in the first quadrant and then use symmetry to create the rose graph for the equation r = 2 cosine 2 theta.
🌀 Understanding Symmetry and Non-Existence of Points
The final paragraph discusses the implications of evaluating polar equations that result in negative r squared values, leading to imaginary numbers. It explains that these values cannot be plotted on the polar coordinate system and why certain quadrants may not contain any points for the graph. The presenter uses the equation r^2 = 4 sine 2 theta as an example to illustrate this concept and the resulting lemniscate graph that exists only in specific quadrants due to symmetry.
🎓 Conclusion and Summary
The video concludes with a summary of the key points covered. It emphasizes the importance of finding symmetry in polar equations to simplify the graphing process. The presenter encourages viewers to practice identifying symmetry, limiting the number of points they plug in, and using symmetry to mirror the graph. The goal is to provide an understanding of how to effectively graph polar equations without the need for complex rectangular conversions.
Mindmap
Keywords
💡Symmetry
💡Polar Equations
💡Trigonometry
💡Polar Coordinates
💡Rectangular Coordinates
💡Sine and Cosine Functions
💡Graphing
💡Even and Odd Functions
💡Unit Circle
💡Cardioid
💡Lemniscate
Highlights
The video discusses the importance of symmetry in polar equations and how it simplifies the process of graphing them.
Some polar equations do not translate well into rectangular coordinates, making symmetry a crucial aspect for graphing.
Symmetry about the polar axis (x-axis) occurs when plugging in negative theta yields the same equation.
Symmetry about the y-axis (pi/2 axis) is identified when replacing theta with (pi - theta) simplifies to the original equation.
Symmetry about the pole is present when changing the sign of r in the equation results in the same equation.
The process of identifying symmetry can significantly reduce the number of points that need to be plotted.
The video demonstrates how to apply symmetry to graph the equation r = 1 - sine(theta), resulting in a cardioid shape.
For the equation r = 1 + 2 cosine(theta), symmetry about the polar axis is established due to the even nature of cosine.
The use of sum and difference formulas for cosine and sine is essential for evaluating symmetry about different axes.
The video introduces the concept of a lemniscate, a figure-eight shaped curve, formed by the equation r = 2 cosine(2 theta).
When symmetry is present about the pole, only two quadrants need to be graphed due to the reflection property.
The video explains how to handle polar equations that result in imaginary numbers, which cannot be plotted on the real coordinate system.
The final example demonstrates a polar equation that is symmetric about the pole, resulting in a lemniscate with only existing points in quadrants one and three.
The presenter emphasizes the practicality of using symmetry to avoid plotting all points around a unit circle, thus simplifying the graphing process.
The video concludes with encouragement for viewers to practice graphing polar equations using symmetry to enhance understanding and efficiency.
Throughout the video, the method of substituting negative theta, pi - theta, and negative r is used to check for different types of symmetry.
The concept of even and odd functions is used to predict the outcome of symmetry checks without actual substitution.
The video provides a step-by-step guide on how to graph polar equations by first checking for symmetry, then plotting a limited set of points, and finally mirroring the graph according to the identified symmetry.
Transcripts
Browse More Related Video
Polar Equations & Graphs (Trigonometry/Precalculus) | Math with Professor V
How to Graph Basic Polar Equations (Precalculus - Trigonometry 41)
Ch. 8.2 Graphs of Polar Equations
Polar Coordinates and Polar Graphs

AP Calculus BC Lesson 9.9
How to Convert From Rectangular Equations to Polar Equations (Precalculus - Trigonometry 39)
5.0 / 5 (0 votes)
Thanks for rating: