How to Graph Basic Polar Equations (Precalculus - Trigonometry 41)
TLDRThe video script presents a comprehensive guide on graphing polar equations by converting them into rectangular equations, which are more familiar to viewers. The host begins by emphasizing the importance of understanding basic polar equations and their graphical representations. Using fundamental trigonometric identities, the video demonstrates how to transform polar equations into their rectangular counterparts, allowing for a clearer visualization of the shapes they represent. The script covers several examples, including equations that result in circles, diagonal lines, and horizontal lines. It also touches on the concept of completing the square to identify and graph circles that have been shifted along the coordinate axes. The host concludes by highlighting the benefits of using symmetry for more advanced polar equations in future videos, promising a deeper exploration of the topic.
Takeaways
- 📐 Polar equations can be graphed by transforming them into rectangular (Cartesian) equations for better visualization.
- 🔴 The equation r = 3 represents a circle with a radius of 3, centered at the origin.
- 📈 When the angle θ is constant (e.g., π/4), the graph is a diagonal line through the origin, indicating every point maintains that constant angle from the polar axis.
- 🌀 For equations like r sin θ = 2, the graph is a horizontal line at y = 2, which in polar coordinates means both r and θ vary to maintain points on that line.
- ⏫ The equation r cos θ = -3 translates to a vertical line at x = -3, where only the angle varies to achieve points on the line.
- 🔄 The transformation process involves using identities like x^2 + y^2 = r^2, r cos θ = x, and r sin θ = y.
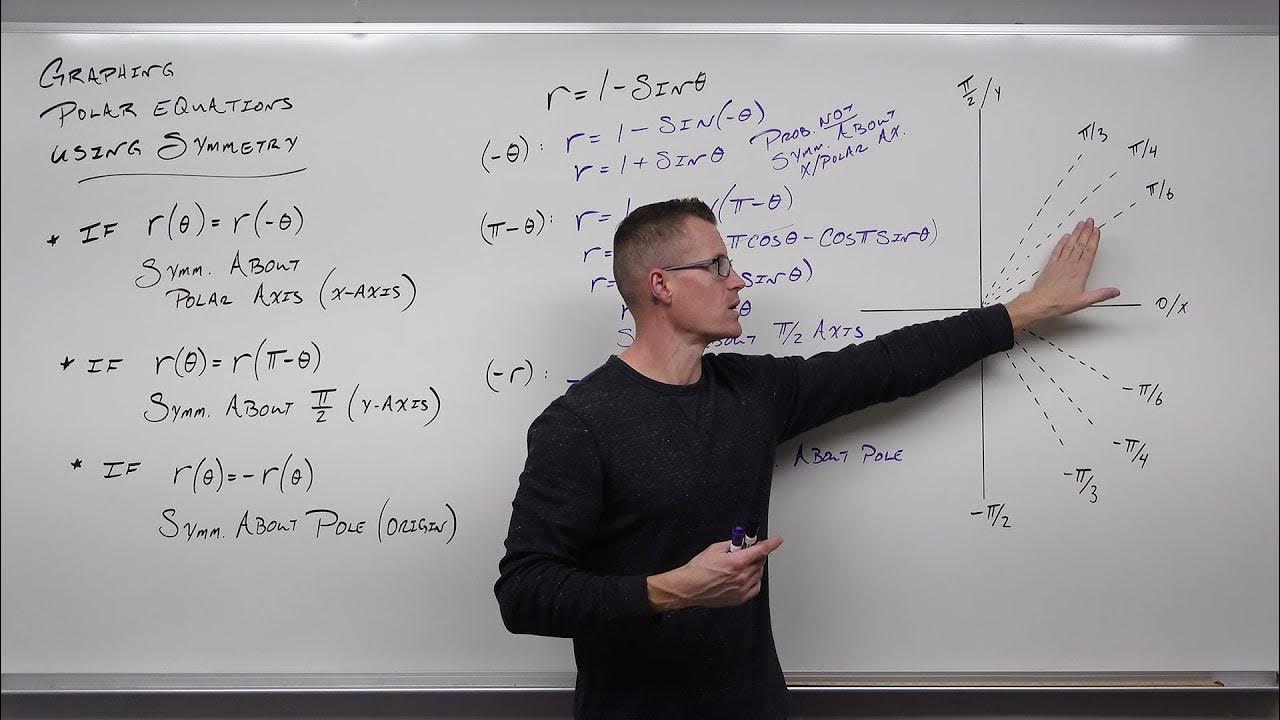
- 🚫 For more complex polar equations, using symmetry can be more effective than converting to rectangular equations, which can become cumbersome.
- 🔄 Completing the square is a useful technique for converting polar equations into a form that represents circles or other conic sections.
- 🔲 The presence of constants in polar equations often indicates a circle or a line, and their transformation can reveal shifts and rotations of these basic shapes.
- 🔑 Understanding the relationship between sine and cosine with x and y coordinates is crucial for translating polar to rectangular equations.
- ➡️ Transformation rules in polar coordinates, such as shifts along the x or y axis, often involve the opposite direction due to the nature of polar to Cartesian conversion.
Q & A
What is the main topic of the video?
-The main topic of the video is how to graph polar equations by transforming them into rectangular equations for better visualization and understanding.
What is the significance of the identity x^2 + y^2 = r^2 in polar coordinates?
-The identity x^2 + y^2 = r^2 represents the Pythagorean theorem applied to right triangle trigonometry in polar coordinates, where r is the radial distance from the pole (origin) to a point, and it is used to convert polar equations into rectangular form.
How does the video explain the graph of the polar equation r = 3?
-The video explains that the graph of r = 3 is a circle with a radius of three centered at the origin. This is derived by squaring both sides of the equation to get r^2 = 9, and then using the identity x^2 + y^2 = r^2 to translate it into a rectangular equation x^2 + y^2 = 9.
What does the video say about the polar equation with a constant angle?
-The video states that if the angle (theta) is constant, the graph will be a diagonal line passing through the origin, regardless of the value of r, as long as it is positive or negative.
How does the video describe the process of graphing the polar equation r sin theta = 2?
-The video describes that the graph of r sin theta = 2 can be understood as a horizontal line at y = 2 in rectangular coordinates. This is because r sin theta translates to y, and setting it equal to 2 gives a constant y-value.
What is the purpose of completing the square when converting polar equations to rectangular equations?
-Completing the square is used to make the equation factorable as a perfect square, which helps in identifying the graph as a circle or another conic section and determining its center and radius.
What does the video suggest about the graph of the polar equation r cos theta = -3?
-The video suggests that the graph of r cos theta = -3 is a vertical line at x = -3 in rectangular coordinates, as r cos theta translates to x, and setting it equal to -3 gives a constant x-value.
How does the video explain the shifts in polar graphs?
-The video explains that shifts in polar graphs are determined by the coefficients of sine and cosine. A positive coefficient in front of sine results in an upward shift, while a negative coefficient in front of cosine results in a leftward shift.
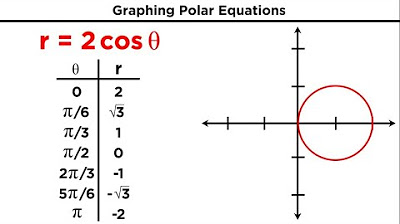
What does the video say about the polar equation r = 4 sin theta?
-The video explains that r = 4 sin theta represents a circle with a radius of two that has been shifted up by two units along the y-axis in rectangular coordinates.
What does the video suggest for more complex polar equations that are difficult to convert into rectangular equations?
-The video suggests that for more complex polar equations, it might be easier to use symmetry properties of sine and cosine functions to graph them directly in polar coordinates without converting to rectangular equations.
What is the next topic the video series will cover?
-The next topic the video series will cover is how to graph more advanced polar equations using symmetry, which can be easier for certain types of equations that are difficult to convert into rectangular form.
Outlines
📈 Introduction to Graphing Polar Equations
The video begins with an introduction to graphing polar equations, emphasizing the basics and the transition from polar to rectangular coordinates. The host explains that understanding polar equations involves converting them into forms we are more familiar with, such as circles with a specific radius. The video promises a deeper dive into symmetry and advanced polar equations in the next installment, where complex shapes will be graphed using symmetry rather than rectangular equations.
🔵 Graphing a Circle with Constant Radius
The host demonstrates how to graph the polar equation r=3 by converting it into a rectangular equation. By squaring both sides to get r^2 = 9 and using the identity x^2 + y^2 = r^2, the equation is translated into x^2 + y^2 = 9, which is recognized as a circle with a radius of three centered at the origin. The process illustrates the value of transforming polar equations into a more visual format for easier understanding.
🟠 Graphing a Line with Constant Angle
The video then explores the scenario where the angle θ is constant, specifically at π/4. By taking the tangent of both sides of the equation, the host translates the polar equation into a rectangular equation y = x, which represents a diagonal line. This line passes through the origin and is a result of holding the angle constant, regardless of the radius r, which can be any positive or negative value.
🔴 Translating Polar Equations with r and θ Variables
The host tackles more complex polar equations where both r and θ are variables. By translating r sin θ = 2 into a rectangular equation y = 2, it is revealed that this represents a horizontal line. Similarly, r cos θ = -3 is translated into x = -3, indicating a vertical line. The video emphasizes the challenges of graphing these equations in polar form and the benefits of using rectangular coordinates for clarity.
🟣 Completing the Square for Shifted Circles
The video script outlines the process of completing the square to graph polar equations that represent shifted circles. The host walks through the steps of multiplying by r, rearranging terms, and adding constants to complete the square for both x and y variables. This process transforms the polar equation r = 4 sin θ into a recognizable form of a circle with a radius of two, shifted up two units along the y-axis. Completing the square is a crucial technique for graphing more complex polar equations.
🔲 Shifts and Transformations in Polar Coordinates
The final paragraph delves into the concept of shifts and transformations in polar coordinates. The host translates r = -2 cos θ into a rectangular equation and uses completing the square to identify it as a circle with a radius of one, shifted left one unit. The video emphasizes the importance of understanding transformations and the direction of shifts, which can be counterintuitive due to the nature of polar coordinates. The host also teases the next video, which will cover more advanced techniques for graphing polar equations using symmetry.
Mindmap
Keywords
💡Polar Equations
💡Rectangular Coordinates
💡Pythagorean Identity
💡Symmetry
💡Graphing
💡Circle
💡Diagonal Line
💡Tangent
💡Completing the Square
💡Transformation
💡Conic Sections
Highlights
The video discusses how to graph polar equations by transforming them into rectangular equations for a clearer understanding.
Basic identities such as x^2 + y^2 = r^2, r*cos(θ) = x, and r*sin(θ) = y are fundamental for translating polar to rectangular equations.
The equation r = 3 represents a circle with a radius of three, centered at the origin.
An equation with a constant angle, such as θ = π/4, results in a diagonal line in rectangular coordinates.
The equation r*sin(θ) = 2 translates to a horizontal line at y = 2 in rectangular coordinates.
For r*cos(θ) = -3, the graph is a vertical line at x = -3, indicating the benefits of using rectangular equations for certain constant representations.
The process of completing the square is introduced to transform polar equations into a form that resembles conic sections.
The video explains how to identify shifts in graphs, such as vertical shifts up for sine and horizontal shifts left for cosine in polar equations.
The equation r = 4*sin(θ) is shown to represent a circle with a radius of two, shifted up by two units along the y-axis.
The video emphasizes the importance of understanding transformations and how they affect the x and y coordinates in different coordinate systems.
An equation like r = -2*cos(θ) is transformed into a circle equation with a radius of one, shifted left by one unit.
The video concludes by noting that while basic polar equations can be translated into rectangular equations, more complex ones may be better approached using symmetry.
The next video will delve into more advanced polar equations and the use of symmetry for graphing without the need for rectangular translations.
The concept of completing the square is applied to polar equations to factor them into a form that represents shifted circles.
The video demonstrates the translation of polar equations into rectangular form using the identities and completing the square technique.
The graphical representation of polar equations with constant r values results in circles, while constant theta values result in lines.
The video provides a step-by-step guide on how to manipulate polar equations into a form that can be easily graphed and understood.
Understanding the relationship between r, theta, x, and y is crucial for translating polar equations into their rectangular counterparts.
The video uses the Pythagorean identity and trigonometric relationships to convert polar equations into a more familiar rectangular form.
For more complex polar equations, the use of symmetry can simplify the graphing process without needing to convert to rectangular equations.
Transcripts
Browse More Related Video
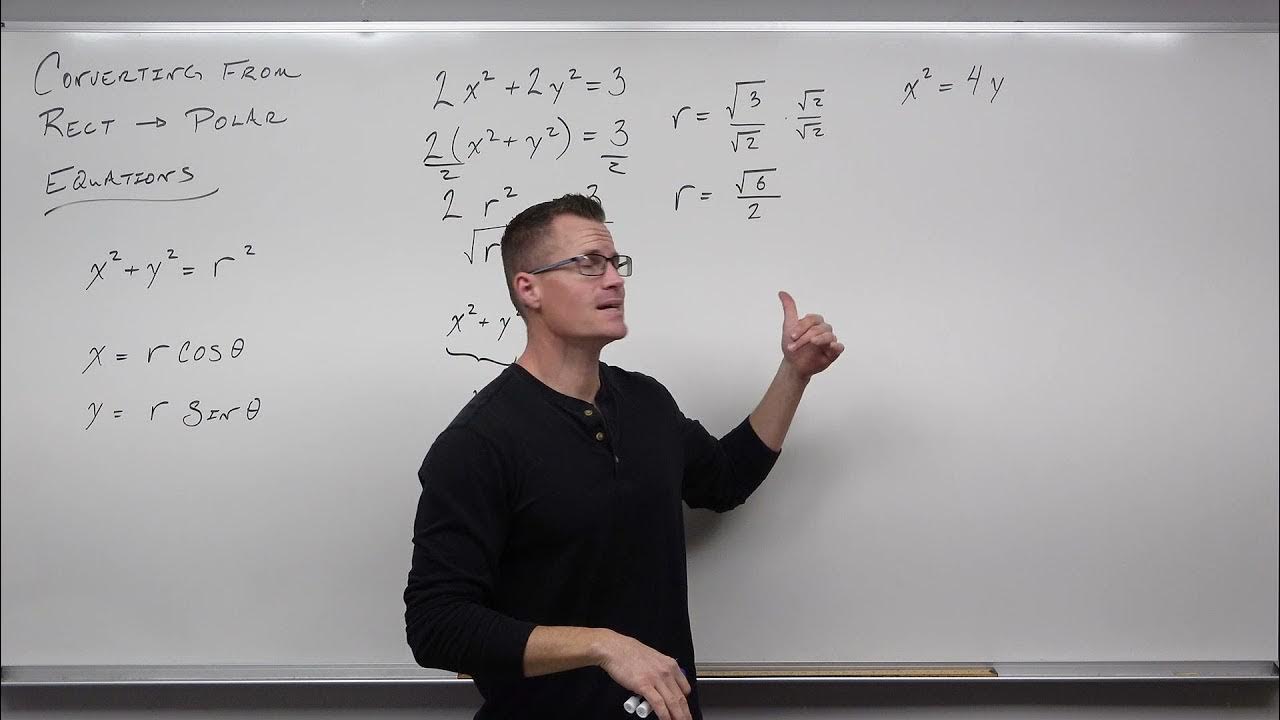
How to Convert From Rectangular Equations to Polar Equations (Precalculus - Trigonometry 39)
Polar Curves
Polar Equations & Graphs (Trigonometry/Precalculus) | Math with Professor V
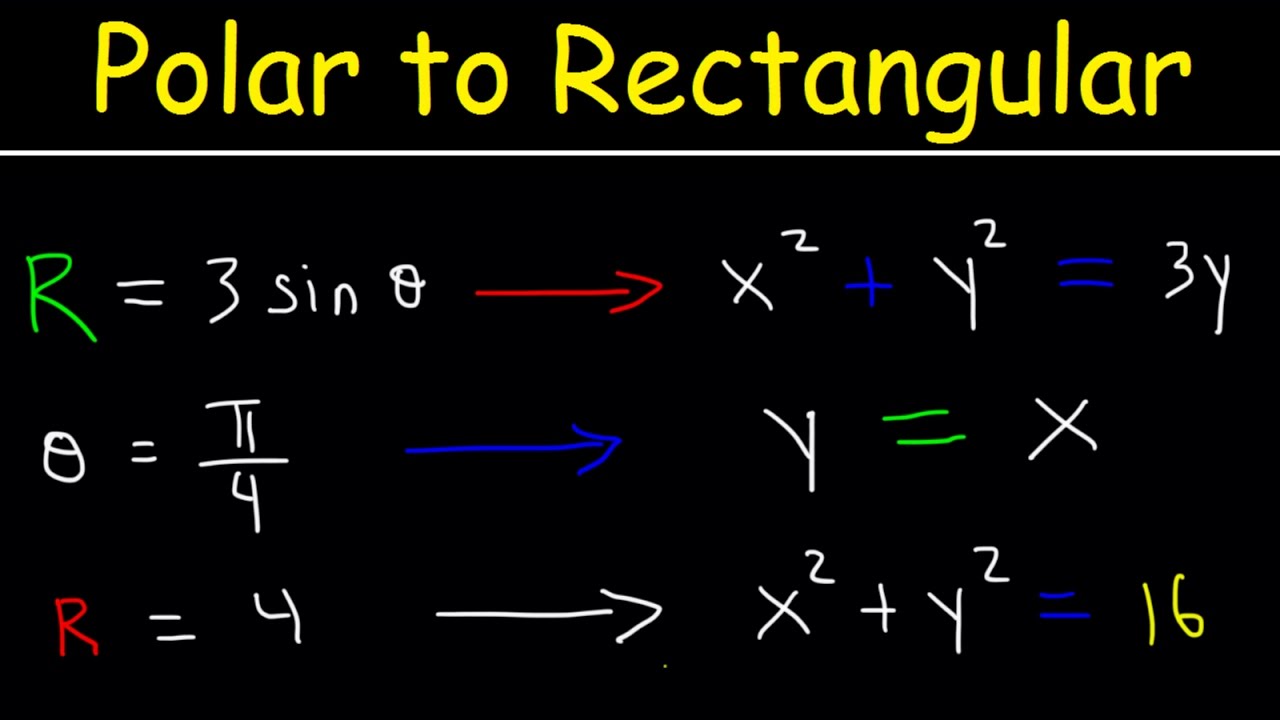
Polar Equations to Rectangular Equations, Precalculus, Examples and Practice Problems
How to Graph Advanced Polar Equations with Symmetry (Precalculus - Trigonometry 42)
Polar Coordinates and Graphing Polar Equations
5.0 / 5 (0 votes)
Thanks for rating: