Ch. 8.2 Graphs of Polar Equations
TLDRThis lecture explores the graphs of polar equations, emphasizing the process of plotting on a polar coordinate system. It explains the importance of symmetry in reducing the plotting range and highlights common polar curves such as circles, limicons, and roses. The instructor demonstrates how to use standard angles and the unit circle to graph equations like r = 3 cos(2θ), resulting in a four-leaf clover shape. The summary also touches on the significance of symmetry across different axes in polar graphs and the use of polar graph paper for easier plotting.
Takeaways
- 📚 The lesson is focused on section 8.2 about the graphs of polar equations, building on the understanding of polar and rectangular coordinates.
- 📈 Graphing polar equations involves examining one angle at a time, often starting with standard angles like π/6, π/4, π/3, π/2, etc.
- 🔍 The 'r' in polar equations is the dependent variable and is always on the outside of the equation, with a function of 'theta' on the other side.
- 📊 Finding symmetry in polar graphs can significantly reduce the range of angles needed to plot, simplifying the graphing process.
- 🌐 Symmetry across the polar axis (like x-axis symmetry in Cartesian coordinates) can be identified by plugging in negative theta and getting the original equation.
- 📉 Symmetry across the pole (like origin symmetry in Cartesian coordinates) can be found by changing the signs in the function or adding π to the angle and getting the same result.
- 📝 Examples given include graphing r = 3cos(2θ), which results in a four-leaf clover shape, highlighting the importance of plotting multiple values to understand the curve.
- 📐 Polar graphs are easier to plot on a polar coordinate system with circles of radii 1, 2, 3, etc., instead of Cartesian squares, making it simpler to find points.
- 🔄 Polar coordinates have different axes: the pole (origin), and the polar axis (x-axis equivalent), with tick marks in π/12 increments.
- 🌀 Common polar curves include circles (r = constant), sine and cosine variations that can form spirals or shifted circles, and limicons which are dependent on the values of 'a' and 'b'.
- 🌹 Roses and lemniscates are specific types of polar curves characterized by the number of leaves or figure-eight shapes, respectively, determined by the multiples of theta in the equation.
Q & A
What is the main topic of section 8.2 in the transcript?
-The main topic of section 8.2 is the graphs of polar equations.
Why is it necessary to look at one value of theta at a time when graphing polar equations?
-It is necessary to look at one value of theta at a time because it helps to visualize the graph as you go through the unit circle, although it can be time-consuming, it's the fundamental approach to understand the shape of the graph.
What is the role of 'r' in polar equations?
-'r' is the dependent variable in polar equations, representing the radius or distance from the origin (pole) to a point on the graph.
What is the significance of symmetry in polar graphs?
-Symmetry in polar graphs is significant because it limits the range of angles that need to be considered when graphing, reducing the amount of work and allowing for easier visualization of the overall shape.
How does the symmetry across the y-axis in polar coordinates reduce the range of angles to consider?
-If there is symmetry across what would be the y-axis in rectangular coordinates, you only need to graph from 0 to 90 degrees and from 270 to 360 degrees, as the rest of the graph will mirror these sections.
What is the shape of the graph for the polar equation r = 3cos(2θ)?
-The graph for the polar equation r = 3cos(2θ) is a four-leaf clover shape due to the cosine function repeating its values as θ varies.
Why is it recommended to use a grapher for polar equations?
-It is recommended to use a grapher for polar equations because it is difficult to manually determine the shape and positioning between any two values without plotting numerous points, which a grapher can do efficiently.
What are the differences between the polar axis and the x-axis in rectangular coordinates?
-The polar axis is the same as the x-axis in rectangular coordinates, but in polar coordinates, it is referred to as the polar axis because there is no x-coordinate system involved.
How do you determine if a polar graph has symmetry across the polar axis?
-A polar graph has symmetry across the polar axis if plugging in a negative theta into the equation results in the same equation, similar to symmetry across the x-axis in rectangular coordinates.
What are the common polar curves mentioned in the transcript?
-The common polar curves mentioned are circles (r = a constant), limicons (a + bcos(θ) or a + bsin(θ)), and roses (a sin(nθ) or a cos(nθ)), which are characterized by the number of leaves and their orientation.
What is a rose curve in polar coordinates and how is the number of leaves determined?
-A rose curve in polar coordinates has the form of a = a sin(nθ) or a cos(nθ), where 'n' determines the number of leaves. If 'n' is odd, there are 'n' leaves, and if 'n' is even, there are 2 times 'n' leaves.
What are the characteristics of a limicon in polar coordinates?
-A limicon in polar coordinates has the form a + bcos(θ) or a + bsin(θ). The orientation and the presence of an internal spiral depend on the values of 'a' and 'b', with 'a' less than 'b' resulting in an internal spiral and 'a' greater than 'b' resulting in no internal spiral.
How does the orientation of a rose curve change with the use of sine or cosine functions?
-The orientation of a rose curve changes based on whether the function uses sine or cosine. Sine functions result in curves that are situated in the positive y-values, while cosine functions can be adjusted to be situated in the positive x-values or rotated in some form.
Outlines
📚 Introduction to Graphing Polar Equations
This paragraph introduces the topic of graphing polar equations, emphasizing the transition from rectangular to polar coordinates discussed in the previous section. The focus is on understanding how to plot these equations by considering one angle value at a time, typically starting with standard angles. The teacher explains the dependency of 'r' on theta and the importance of recognizing symmetry in polar graphs to reduce the complexity of the plotting process. An example of graphing r = 3cos(2θ) is given, illustrating the process of creating a table of values and plotting points to form a 'four-leaf clover' shape. The paragraph concludes with the suggestion that using a graphing tool is beneficial for visualizing the curves between points.
📐 Understanding Polar Coordinates and Symmetry
The second paragraph delves into the specifics of polar coordinates, contrasting them with the more familiar rectangular coordinates. It describes the polar axis as equivalent to the x-axis and explains the concept of radii circles for plotting. The teacher discusses the importance of identifying symmetry in polar graphs, such as across the polar axis, the pole, and the vertical axis, to streamline the graphing process. Examples are provided to illustrate how symmetry can be determined by plugging in negative theta or changing the signs in the equation, and how adding or subtracting pi from the angle can reveal symmetry properties.
🌀 Common Polar Curves and Their Characteristics
This paragraph explores various common shapes that can be represented by polar equations, such as circles, limacons, and roses. It explains how a constant 'r' value results in a circle, while sine and cosine functions with 'r' can create different types of curves. The teacher introduces limacons, which can have different orientations and shapes based on the values of 'a' and 'b', and roses, which are characterized by the number of leaves determined by the multiple of theta in the equation. The discussion includes how the orientation and values of 'a' and 'b' affect the appearance of the resulting graph, and the significance of the multiple of theta in roses for the number of leaves.
🎨 Graphing Complex Polar Equations: Lemon Skates
The final paragraph discusses a specific type of polar graph known as lemon skates, which are figure-eight shaped curves. The teacher explains the mathematical form of these equations, which involve squared sine or cosine functions of a doubled theta. The paragraph clarifies how these equations result in the distinctive infinity symbol shape of lemon skates, providing a clear example of more complex polar graphs. It concludes the script with a comprehensive overview of the variety of shapes that can be graphed using polar coordinates, highlighting the uniqueness of each type of curve.
Mindmap
Keywords
💡Polar Equations
💡Unit Circle
💡Symmetry
💡Graphing
💡Polar Axis
💡Pole
💡Standard Angles
💡Radian
💡Limacons
💡Roses
💡Lemon Skates
Highlights
Introduction to Section 8.2 on graphs of polar equations.
Explanation of transitioning between rectangular and polar coordinates.
Technique for graphing polar equations by considering one angle at a time.
Use of standard angles on the unit circle for graphing polar coordinates.
Clarification of 'r' as the dependent variable in polar equations.
The importance of recognizing symmetry in polar graphs to simplify graphing.
Method to limit graphing range based on symmetry across different axes.
Example graphing of the polar equation r = 3 cos(2θ) resulting in a four-leaf clover shape.
Discussion on the difficulty of graphing polar equations without a grapher.
Description of the polar graph setup with the pole and polar axis.
Explanation of plotting points in polar coordinates using circles of radii.
Identification of symmetry types in polar equations for easier graphing.
Examples of symmetry across the polar axis and the pole in polar equations.
Common polar curves such as circles, limicons, and roses explained.
Description of how to identify and graph limicons based on the values of 'a' and 'b'.
Explanation of roses in polar graphs and their relation to the number of leaves.
Introduction to lemniscates as figure-eight shaped curves in polar coordinates.
Transcripts
Browse More Related Video
Polar Equations & Graphs (Trigonometry/Precalculus) | Math with Professor V
Lec 33 | MIT 18.01 Single Variable Calculus, Fall 2007
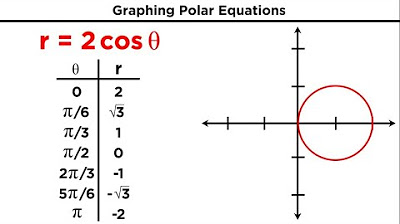
Polar Coordinates and Graphing Polar Equations
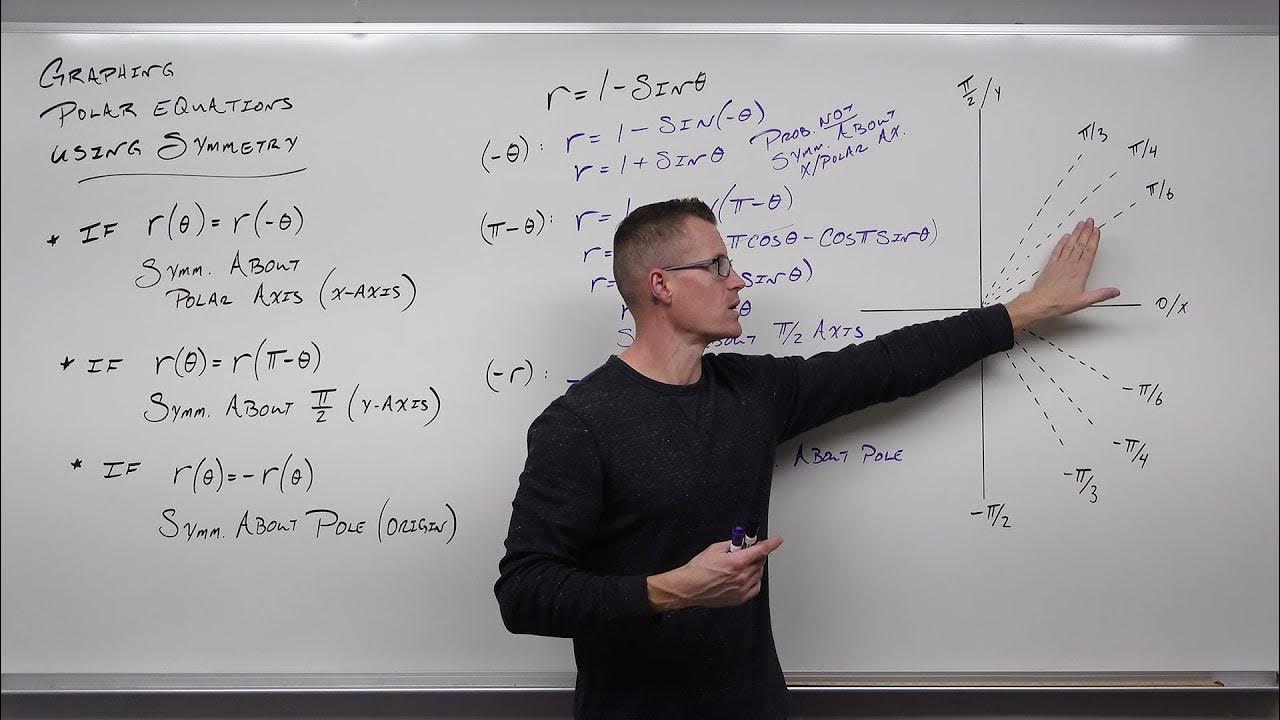
How to Graph Advanced Polar Equations with Symmetry (Precalculus - Trigonometry 42)

Calculus 2: Polar Coordinates (Video #30) | Math with Professor V
How to Graph Basic Polar Equations (Precalculus - Trigonometry 41)
5.0 / 5 (0 votes)
Thanks for rating: