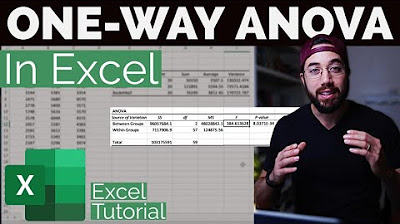
ANOVA and T test in Excel
TLDRThis video tutorial offers a concise guide on performing ANOVA and t-tests in Excel, using a fictional Hogwarts dataset. It explains the process of conducting one-way ANOVA to determine if there are significant differences among the four houses' subpopulations. The video then demonstrates how to perform t-tests to compare specific pairs of categories, highlighting the interpretation of p-values to ascertain statistical significance. The tutorial is designed to help viewers understand the basic principles of analyzing categorical predictors and continuous response variables.
Takeaways
- 📚 The video is a tutorial on conducting ANOVA and t-tests in Excel using a practice data file.
- 🔍 The data file contains multiple categories, representing different 'houses', and continuous quantitative values.
- 📈 ANOVA is suitable for analyzing data with more than two categorical independent variables, in this case, the four houses.
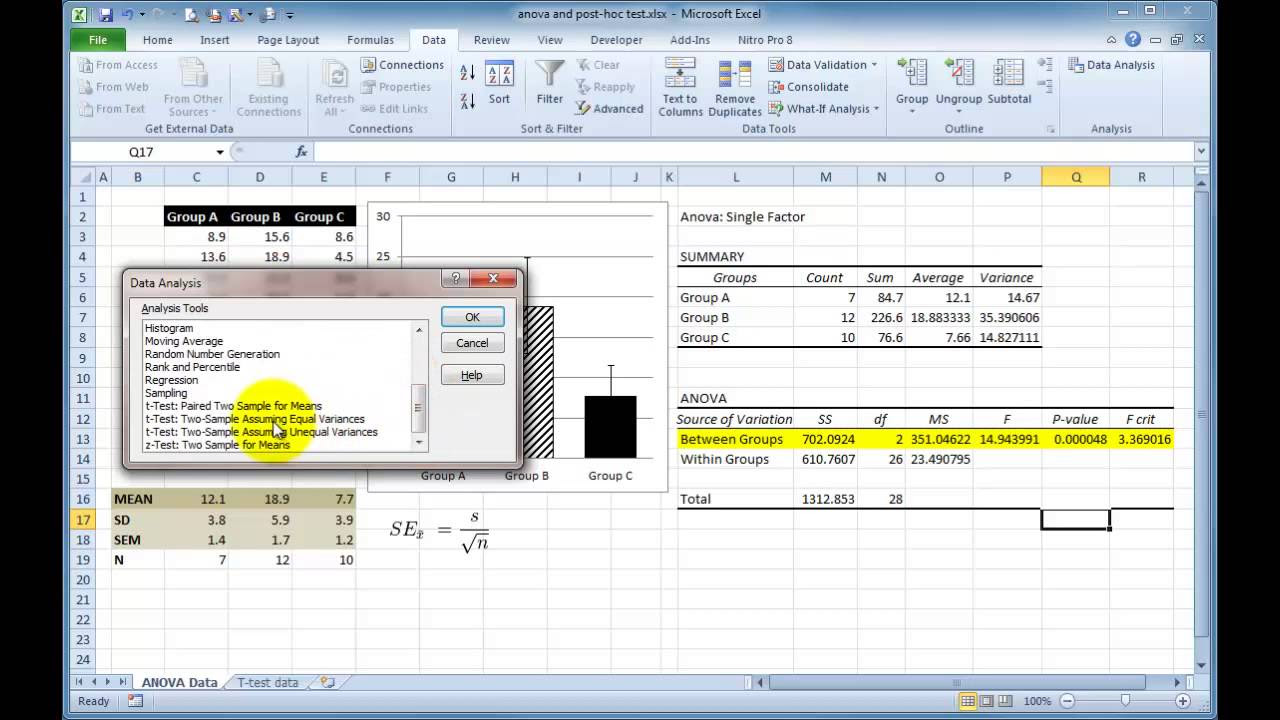
- 🛠 To perform ANOVA in Excel, the Data Analysis Toolpak must be activated and the 'Single Factor ANOVA' option is selected.
- 📊 The purpose of ANOVA is to test if the means of the subpopulations (houses) differ from the overall population mean.
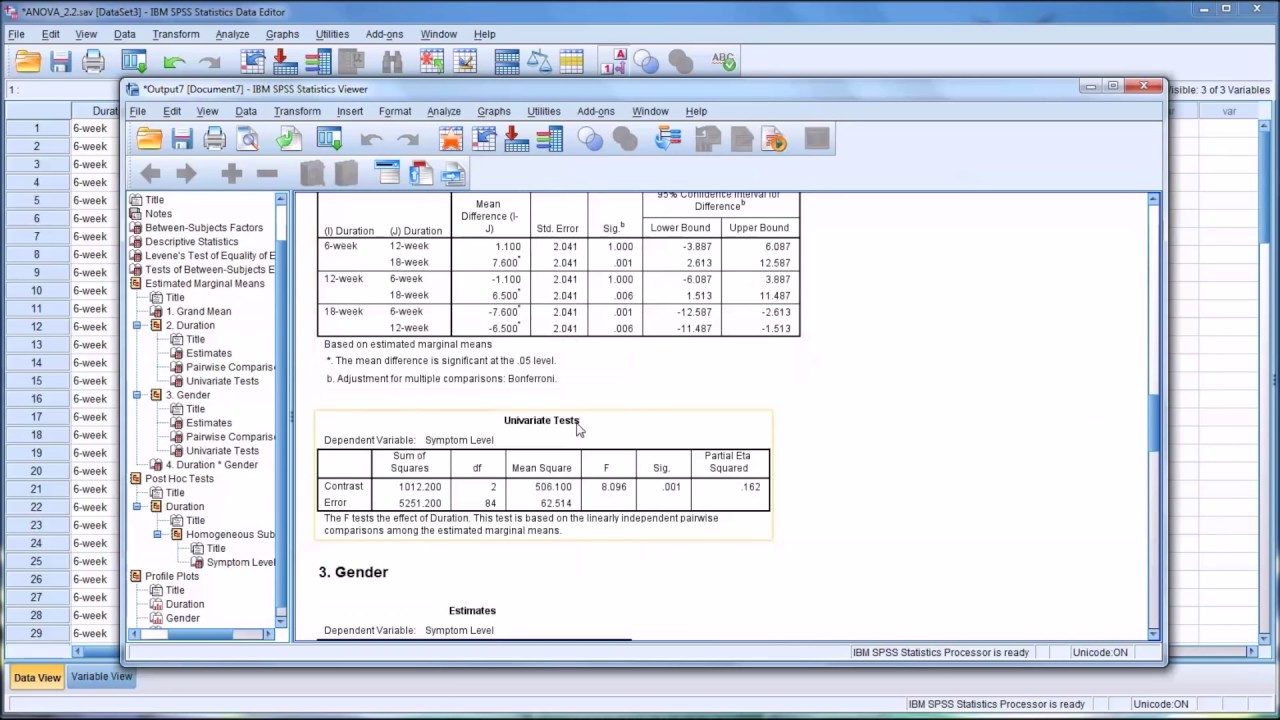
- 🔢 The F-statistic and p-value are key results from ANOVA; a very small p-value indicates significant differences between the groups.
- 🏠 The example uses Hogwarts houses to illustrate the data, with the understanding that the actual data would be more complex.
- 🤔 If ANOVA shows significant differences, it does not specify which groups differ; further analysis is needed.
- 🔎 To explore specific differences between two groups, a t-test for independent samples can be conducted.
- 📝 The t-test results provide p-values for one-tailed and two-tailed tests, indicating the likelihood of one group being higher or lower than the other.
- 🔑 A small p-value in the t-test (typically less than 0.05) suggests that there is a statistically significant difference between the two groups being compared.
Q & A
What is the purpose of the video?
-The video is a tutorial on how to conduct an ANOVA and a t-test in Excel using a practice data file.
What does the video refer to as the 'practice data file'?
-The 'practice data file' is a dataset uploaded on Canvas that contains hypothetical data for a study involving categories and quantitative values.
What are the categories mentioned in the video?
-The categories mentioned are Hufflepuff, Ravenclaw, Gryffindor, and Slytherin, which are used as categorical independent variables in the analysis.
Why is ANOVA a suitable analysis for this dataset?
-ANOVA is suitable because it allows for the comparison of means across more than two categorical predictor variables, in this case, the four houses.
What does the video suggest to do if the Data Analysis Toolpak is not activated?
-The video suggests making sure the Data Analysis Toolpak is activated in Excel to perform the ANOVA and t-tests.
What is the difference between a one-way ANOVA and a two-way ANOVA?
-A one-way ANOVA tests for differences in means among three or more independent groups, while a two-way ANOVA tests for differences in means among groups defined by two independent variables.
What does the video imply about the p-value of the ANOVA test?
-The video implies that a very small p-value, such as 8.77 x 10^-83, indicates a high degree of certainty that the means of the subpopulations (houses) differ significantly.
What is the purpose of a t-test in the context of the video?
-The t-test is used to compare the means of two specific categories to determine if there is a statistically significant difference between them.
What does the video explain about the relationship between one-tailed and two-tailed p-values?
-The video explains that the one-tailed p-value tests for a difference in one direction, while the two-tailed p-value tests for a difference in either direction, with the two-tailed p-value being twice the one-tailed p-value.
How does the video suggest interpreting the results of the t-test between Hufflepuff and Gryffindor?
-The video suggests that a p-value of 2.34 x 10^-29 for the t-test indicates a statistically significant difference between Hufflepuff and Gryffindor, as it is less than 0.05.
What conclusion does the video draw about the difference between Hufflepuff and Ravenclaw based on the t-test?
-The video concludes that there is no statistically significant difference between Hufflepuff and Ravenclaw based on a p-value of 0.24, which is greater than 0.05.
Outlines
📊 Introduction to ANOVA and T-Test in Excel
This paragraph introduces a tutorial on performing ANOVA (Analysis of Variance) and T-Tests in Excel. The instructor guides students to open a practice data file on the canvas, which contains categorized data representing four houses from Hogwarts with associated quantitative values. The focus is on using ANOVA to analyze the differences between these categories when there are more than two categorical independent variables. The tutorial explains the process of selecting the data and running a one-way ANOVA to test for mean invariance across the subpopulations of each house. The results are interpreted, highlighting a very small p-value, which suggests that the houses are significantly different from each other. However, ANOVA does not specify which houses differ, prompting the use of T-Tests for pairwise comparisons.
🔍 Further Analysis with T-Tests and Interpreting Results
Building on the initial ANOVA, this paragraph delves into using T-Tests for pairwise comparisons between the houses to determine which specific categories differ. The instructor demonstrates how to perform a T-Test for two sample means, comparing Hufflepuff with Gryffindor and noting a statistically significant difference with a very small p-value, indicating that the two houses' means are not the same. Conversely, when comparing Hufflepuff with Ravenclaw, the p-value is much larger, suggesting no detectable difference between the two based on the current dataset. The paragraph concludes by emphasizing that while ANOVA identified a difference, it does not specify which categories are different, necessitating further investigation through T-Tests to clarify specific contrasts.
Mindmap
Keywords
💡ANOVA
💡t-test
💡Excel
💡categorical predictor variables
💡continuous response variables
💡F-statistic
💡p-value
💡replication
💡one-way ANOVA
💡pairwise comparison
💡statistical significance
Highlights
Introduction to conducting ANOVA and t-tests in Excel using a practice data file.
Explanation of the data structure with categorical predictor variables and quantitative values.
Use of ANOVA for multiple categorical predictor variables to determine if subpopulation means differ.
Instructions on activating the Data Analysis Toolpak in Excel.
Guidance on selecting the appropriate ANOVA test type for the data.
Interpretation of the ANOVA output, focusing on the F-statistic and p-value.
Understanding the significance of a very small p-value in rejecting the null hypothesis.
Introduction to t-tests for comparing two categories when ANOVA indicates a significant difference.
How to perform a t-test in Excel to compare means between two groups.
Explanation of one-tailed and two-tailed p-values in t-test results.
Interpretation of t-test results to determine statistical significance between two groups.
Demonstration of a t-test comparing Hufflepuff and Gryffindor with a significant difference.
Example of a t-test between Hufflepuff and Ravenclaw showing no significant difference.
The necessity of further analysis to determine which specific groups differ after ANOVA.
Overview of the basic procedure for conducting ANOVA and t-tests in Excel.
Importance of understanding the practical applications of statistical tests in data analysis.
Final summary of the video's content and the steps involved in performing ANOVA and t-tests.
Transcripts
Browse More Related Video
5.0 / 5 (0 votes)
Thanks for rating: