Linear Approximation
TLDRThis video discusses linear approximation, using tangent lines to estimate function values near a point of tangency. Examples include approximating f(1.1) and f(0.99) using the tangent line at x=1, and estimating the square root of 26 using the tangent line at x=25. The video also covers how concavity affects whether the approximation is an overestimate or underestimate.
Takeaways
- 📚 The script discusses the concept of linear approximation, which involves using a tangent line to a function's graph to estimate function values near the point of tangency.
- 📈 An example is provided where the tangent line to the graph of a function f(x) at x = 1 is used to approximate f(1.1) and f(0.99), illustrating the process of finding the equation of the tangent line and plugging in values to estimate the function.
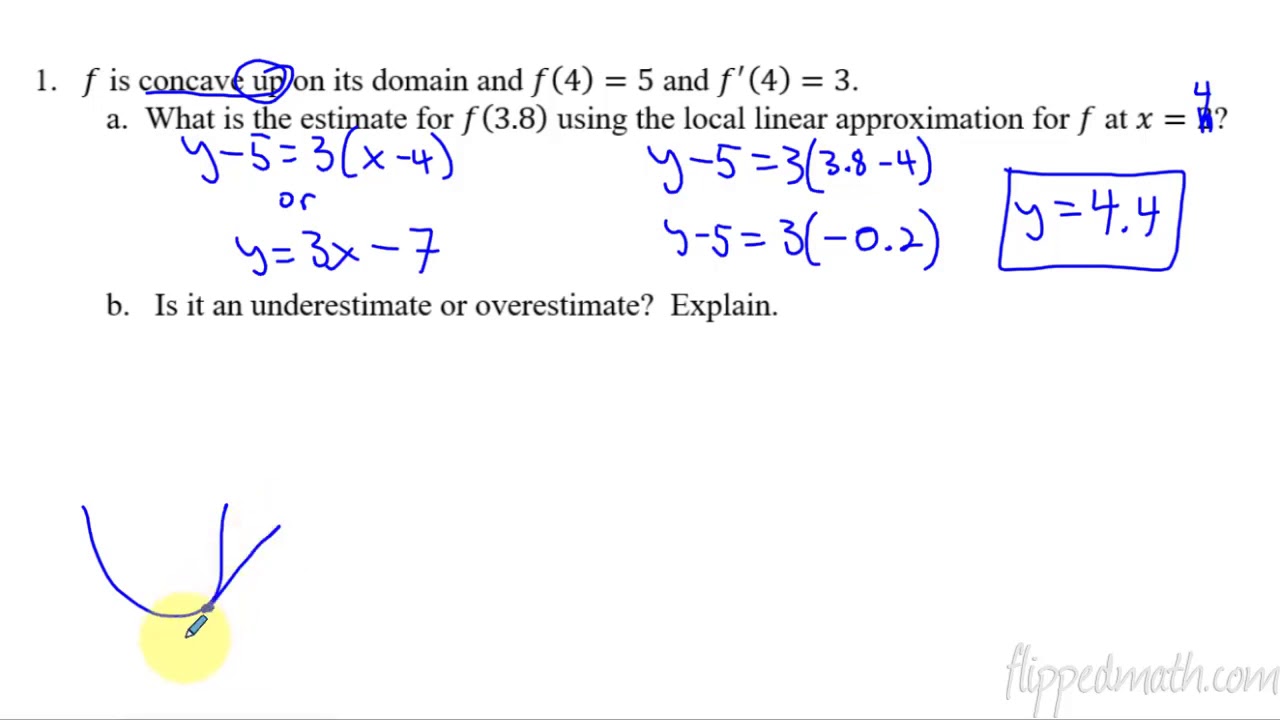
- 🔍 The importance of understanding the concavity of a function is highlighted, as it determines whether the linear approximation is an overestimate or an underestimate near the point of tangency.
- 📉 The script explains that if a function is concave down, linear approximations tend to be overestimates, while if a function is concave up, they tend to be underestimates.
- 🔢 The use of linear approximation to estimate the value of square roots, such as the square root of 26, is demonstrated, showing how to use the tangent line at a known point to get a close estimate.
- 📝 The script encourages viewers to practice linear approximation on their own, particularly with the function value f(0.99) and other similar problems, to reinforce understanding.
- 📉 The concept of using the second derivative to determine the concavity of a function is introduced, which is crucial for understanding whether a linear approximation is an over or underestimate.
- 📊 The script provides a step-by-step guide on how to find the equation of the tangent line to a function at a given point, using the function's value and its first derivative at that point.
- 🤔 The importance of not just memorizing but internalizing the relationship between concavity and the nature of linear approximations (over or underestimate) is emphasized.
- 📚 The script concludes with a discussion of differential equations and how to use implicit differentiation to find the second derivative, which is necessary for analyzing the concavity of a function.
- 📉 An example of using the second derivative test to determine whether a function has a maximum, minimum, or neither at a certain point is given, using the information from a differential equation.
Q & A
What is the purpose of using a tangent line to approximate values of a function?
-The purpose of using a tangent line to approximate values of a function is to estimate the function's values near the point of tangency. This method provides a simple linear approximation that can be used when the exact value of the function is difficult to compute or when an approximate value is sufficient.
How do you find the equation of the tangent line to the graph of a function at a specific point?
-To find the equation of the tangent line, you first need a point on the graph, which is typically given by the function's value at a specific x-coordinate. Then, you find the slope of the tangent line, which is the derivative of the function evaluated at that x-coordinate. The equation of the tangent line can then be written in the form y - y1 = m(x - x1), where (x1, y1) is the point on the graph and m is the slope.
What is the formula used to approximate f(1.1) using the tangent line to the graph of f at x=1?
-The formula used to approximate f(1.1) is y ≈ 4 + 9(0.1), where 4 is the value of f at x=1, and 9 is the slope of the tangent line at x=1. This approximation gives a value of 4.9 for f(1.1).
How can you determine if a linear approximation is an overestimate or an underestimate?
-To determine if a linear approximation is an overestimate or an underestimate, you need to consider the concavity of the function. If the function is concave down near the point of tangency, the linear approximation will be an overestimate. Conversely, if the function is concave up near the point of tangency, the linear approximation will be an underestimate.
What is the significance of the second derivative in determining whether a linear approximation is an overestimate or an underestimate?
-The second derivative indicates the concavity of the function. A positive second derivative (concave up) suggests that the linear approximation will be an underestimate, while a negative second derivative (concave down) suggests that the linear approximation will be an overestimate.
How can you estimate the value of the square root of 26 using linear approximation?
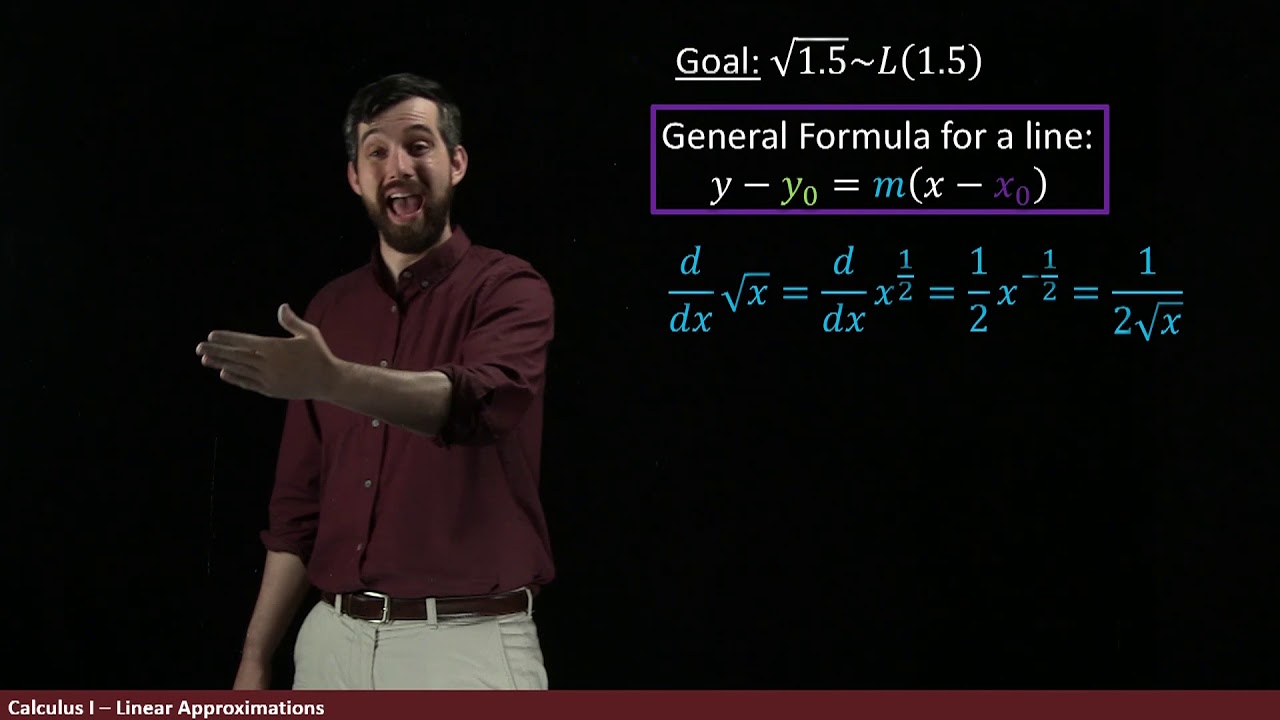
-To estimate the square root of 26 using linear approximation, you can use the tangent line to the graph of the square root function at x=25 (where the square root of 25 is 5). The approximation would be √26 ≈ 5 + (1/10)(26 - 25), which gives an estimate of 5.1.
What is the equation of the tangent line to the graph of y = √x at x=25?
-The equation of the tangent line to the graph of y = √x at x=25 is y - 5 = (1/10)(x - 25). This equation is derived from the point (25, 5) and the slope of the tangent line at x=25.
How does the concavity of a function affect the accuracy of a linear approximation near the point of tangency?
-The concavity of a function affects the accuracy of a linear approximation near the point of tangency by determining whether the approximation will be an overestimate or an underestimate. For values of x very close to the point of tangency, the tangent line provides a good estimate, but the accuracy can vary depending on the concavity.
What is the equation of the tangent line to the graph of a function f at x=1 if f(1) = 4 and f'(1) = 9?
-The equation of the tangent line to the graph of a function f at x=1, given f(1) = 4 and f'(1) = 9, is y - 4 = 9(x - 1). This equation is derived from the point (1, 4) and the slope of 9.
How can you use the second derivative to determine the concavity of a function?
-The second derivative can be used to determine the concavity of a function by examining its sign. If the second derivative is positive, the function is concave up. If the second derivative is negative, the function is concave down. This information can help in understanding whether a linear approximation will be an overestimate or an underestimate.
Outlines
📚 Introduction to Linear Approximation
The video begins by introducing the concept of linear approximation, which involves using a tangent line to a function's graph to estimate function values near a specific point. The instructor uses the function f(x) = x^3 + 3x as an example, deriving the equation of the tangent line at x=1 and then applying it to approximate f(1.1) and f(0.99). The process involves plugging in the values into the tangent line equation and calculating the approximated y-values. The instructor also touches on the concept of overestimation and underestimation in the context of linear approximation, explaining that the concavity of the function near the point of tangency influences whether the approximation is an overestimate or an underestimate.
🔍 Estimating Square Root Values with Linear Approximation
The second paragraph delves into a historical application of linear approximation, estimating the square root of numbers before calculators were widely available. The example given is estimating the square root of 26 using the tangent line to the graph of the square root function at x=25. The instructor calculates the slope of the tangent line and uses it to estimate the square root of 26, comparing the approximation to the actual value obtained from a calculator. The discussion also includes the importance of understanding concavity in determining whether the approximation is an overestimate or an underestimate.
📉 Understanding Concavity in Linear Approximation
In this segment, the instructor emphasizes the importance of internalizing the relationship between concavity and the accuracy of linear approximations, rather than memorizing it. The video explains how to use the second derivative test to determine whether a linear approximation is an overestimate or an underestimate based on the concavity of the function. The instructor also provides an example of estimating the value of a function g at x=4.9 using the tangent line at x=5 and explains how the concavity of g influences the accuracy of the approximation.
📝 Applying Linear Approximation to Differential Equations
The fourth paragraph presents an example from a 1998 exam question involving a differential equation. The instructor demonstrates how to find the slope of the graph of a function at a specific point and then use that slope to write an equation for the tangent line. The video continues with an example of approximating the value of a function f at x=1.2 using the tangent line at x=1. The instructor also discusses the potential for the approximation to be an overestimate or an underestimate based on the function's concavity.
📌 Estimating Function Values with Given Derivatives
The final paragraph discusses a scenario where a function and its first two derivatives are given, and the task is to estimate the value of the function at a specific point, in this case, f(1.5). The instructor uses linear approximation to find the approximate value and then explains how the second derivative can be used to determine whether the approximation is an overestimate or an underestimate. The video concludes with a discussion of a free response question from a 2015 exam, which involves finding the second derivative of a function and using it to analyze the concavity of the solution.
Mindmap
Keywords
💡Linear Approximation
💡Tangent Line
💡Derivative
💡Concavity
💡Second Derivative
💡Estimate
💡Overestimate/Underestimate
💡Initial Condition
💡Differential Equation
💡Implicit Differentiation
💡Free Response Question
Highlights
Introduction to the concept of linear approximation using tangent lines to approximate function values near a point of tangency.
Example given to demonstrate the use of a tangent line to a function at x=1 to approximate f(1.1) and f(0.99).
Explanation of deriving the equation of the tangent line using a point and the derivative of the function.
Calculation of the slope of the tangent line using the derivative of a cubic function.
Method to approximate function values by plugging in x values into the tangent line equation.
Illustration of how to determine if a linear approximation is an overestimate or underestimate based on the concavity of the function.
Drawing a curve that sits only below the tangent line to demonstrate an overestimate.
Discussion on the concavity of a function and its relation to overestimation and underestimation in linear approximations.
Application of linear approximation to estimate the value of the square root of 26, showcasing its practical use.
Use of a tangent line to a square root function to approximate values, highlighting the function's concave down nature.
Explanation of how to handle a problem involving a function, its first two derivatives, and estimating a value.
Process of using given derivatives to write an equation for a tangent line and estimate a function value.
Analysis of whether a linear approximation is greater or less than the actual function value using concavity.
Example of a multiple-choice question involving linear approximation and the use of second derivative information.
Discussion on a free response question from 1998 involving a function with a given slope and using it for linear approximation.
Explanation of how to find the slope of a graph at a specific point using the given information.
Writing an equation for a tangent line using a point and the slope derived from the function's derivative.
Approach to determine if a function has a minimum, maximum, or neither at a specific point using the second derivative test.
Use of a differential equation to explore the concavity of a solution and its implications on the second derivative.
Identification of a function's behavior at a specific point using the second derivative test and the function's initial condition.
Question on writing an equation for a tangent line given a function and its derivative at a specific point.
Estimation of a function value using a tangent line and analysis of whether it's an overestimate or underestimate based on concavity.
Discussion on the existence of a derivative at a point with a sharp corner on the graph of a function's derivative.
Transcripts
Browse More Related Video
Linear Approximations | Using Tangent Lines to Approximate Functions

AP Calculus AB: Lesson 2.6 Tangent Line Approximations
Calculus AB/BC – 4.6 Approximating Values of a Function Using Local Linearity and Linearization
2010 AP Calculus AB Free Response #6

2022 AP Calculus AB Exam FRQ #5

Linear approx. with differentials | MIT 18.01SC Single Variable Calculus, Fall 2010
5.0 / 5 (0 votes)
Thanks for rating: